
In Universal Analytics, marketers relied on “Goals”: specific actions, like a form submission or a purchase, that you configured Google to track. Universal Analytics is gone. It stopped processing data on July 1, 2023, and Google deleted all UA data starting July 1, 2024. Google Analytics 4 (GA4) replaced the rigid "Goals" feature with a flexible, event-based system. In GA4 you flag any meaningful user action as a key event worth measuring. Google renamed these from "conversions" to "key events" in 2024; older articles still call them conversions. The core idea, tracking the actions that matter, is more alive than ever.
Translating Business Ambitions into Analytics Goals
Before you touch a single setting in Google Analytics, the most critical step happens away from the screen. You need to connect your real-world business strategy to what you’re actually measuring online.
Think of goals in Google Analytics not as abstract technical metrics, but as digital finish lines. Each one should represent a tangible win for your business. Establishing this connection from the start is what separates an analytics setup that provides real, actionable intelligence from a dashboard filled with vanity metrics.
Whether your primary objective is to generate qualified leads, sell professional services, or increase user engagement, it all begins by translating that ambition into a quantifiable action. A vague objective like "increase revenue" is impossible to track on its own; it must be broken down into the concrete user actions that lead to that outcome.
This visual perfectly captures the concept: a business ambition drives a specific, trackable action, which in turn delivers the insight you need.
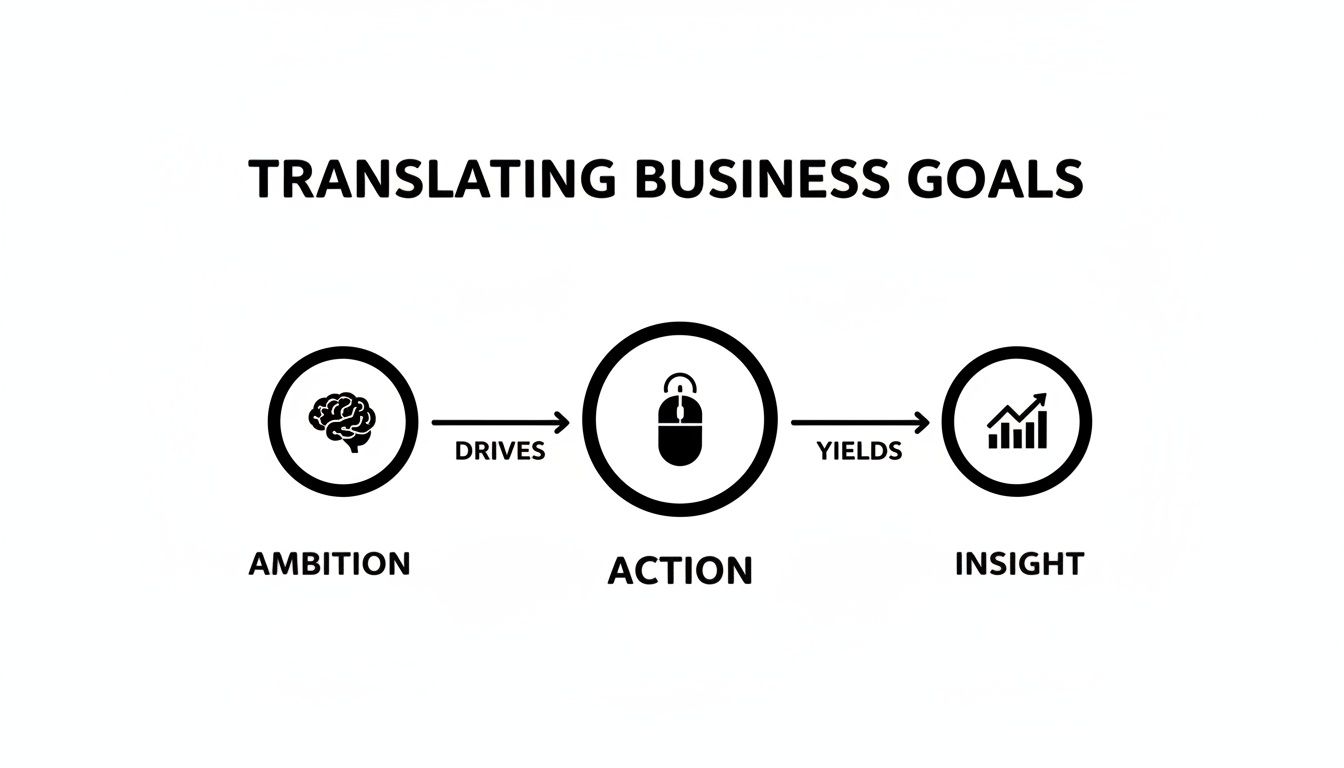
This simple flow is the heart of effective analytics. Without it, you aren't gathering intelligence, you're just collecting data.
From Ambition to Actionable Metrics
The key is to pinpoint the exact website interactions that signal a user is moving closer to becoming a customer. This process turns broad objectives into crisp, trackable events.
Here’s what that translation looks like in practice:
Business Objective: Generate more qualified leads.
Trackable Goal: A user completes and submits your "Request a Quote" form.
Business Objective: Increase engagement with our expert content.
Trackable Goal: A visitor downloads a case study PDF or watches more than 75% of a product demo video.
Business Objective: Grow our email subscriber list.
Trackable Goal: A user successfully signs up for the monthly newsletter.
By defining these digital finish lines first, you ensure that every report and dashboard you build is directly tied to what actually drives business growth. This strategic alignment is fundamental to measuring marketing effectiveness and proving your ROI.
This strategic mindset matters most for teams who came from Universal Analytics (UA). UA’s goal-tracking was rigid and built around sessions. Google Analytics 4 uses a user-focused, event-based model, so you can track a much wider, more nuanced range of important interactions.
Learning to connect your business strategy to these powerful new tracking capabilities is the first step toward mastering modern analytics.
Understanding Universal Analytics Goal Types
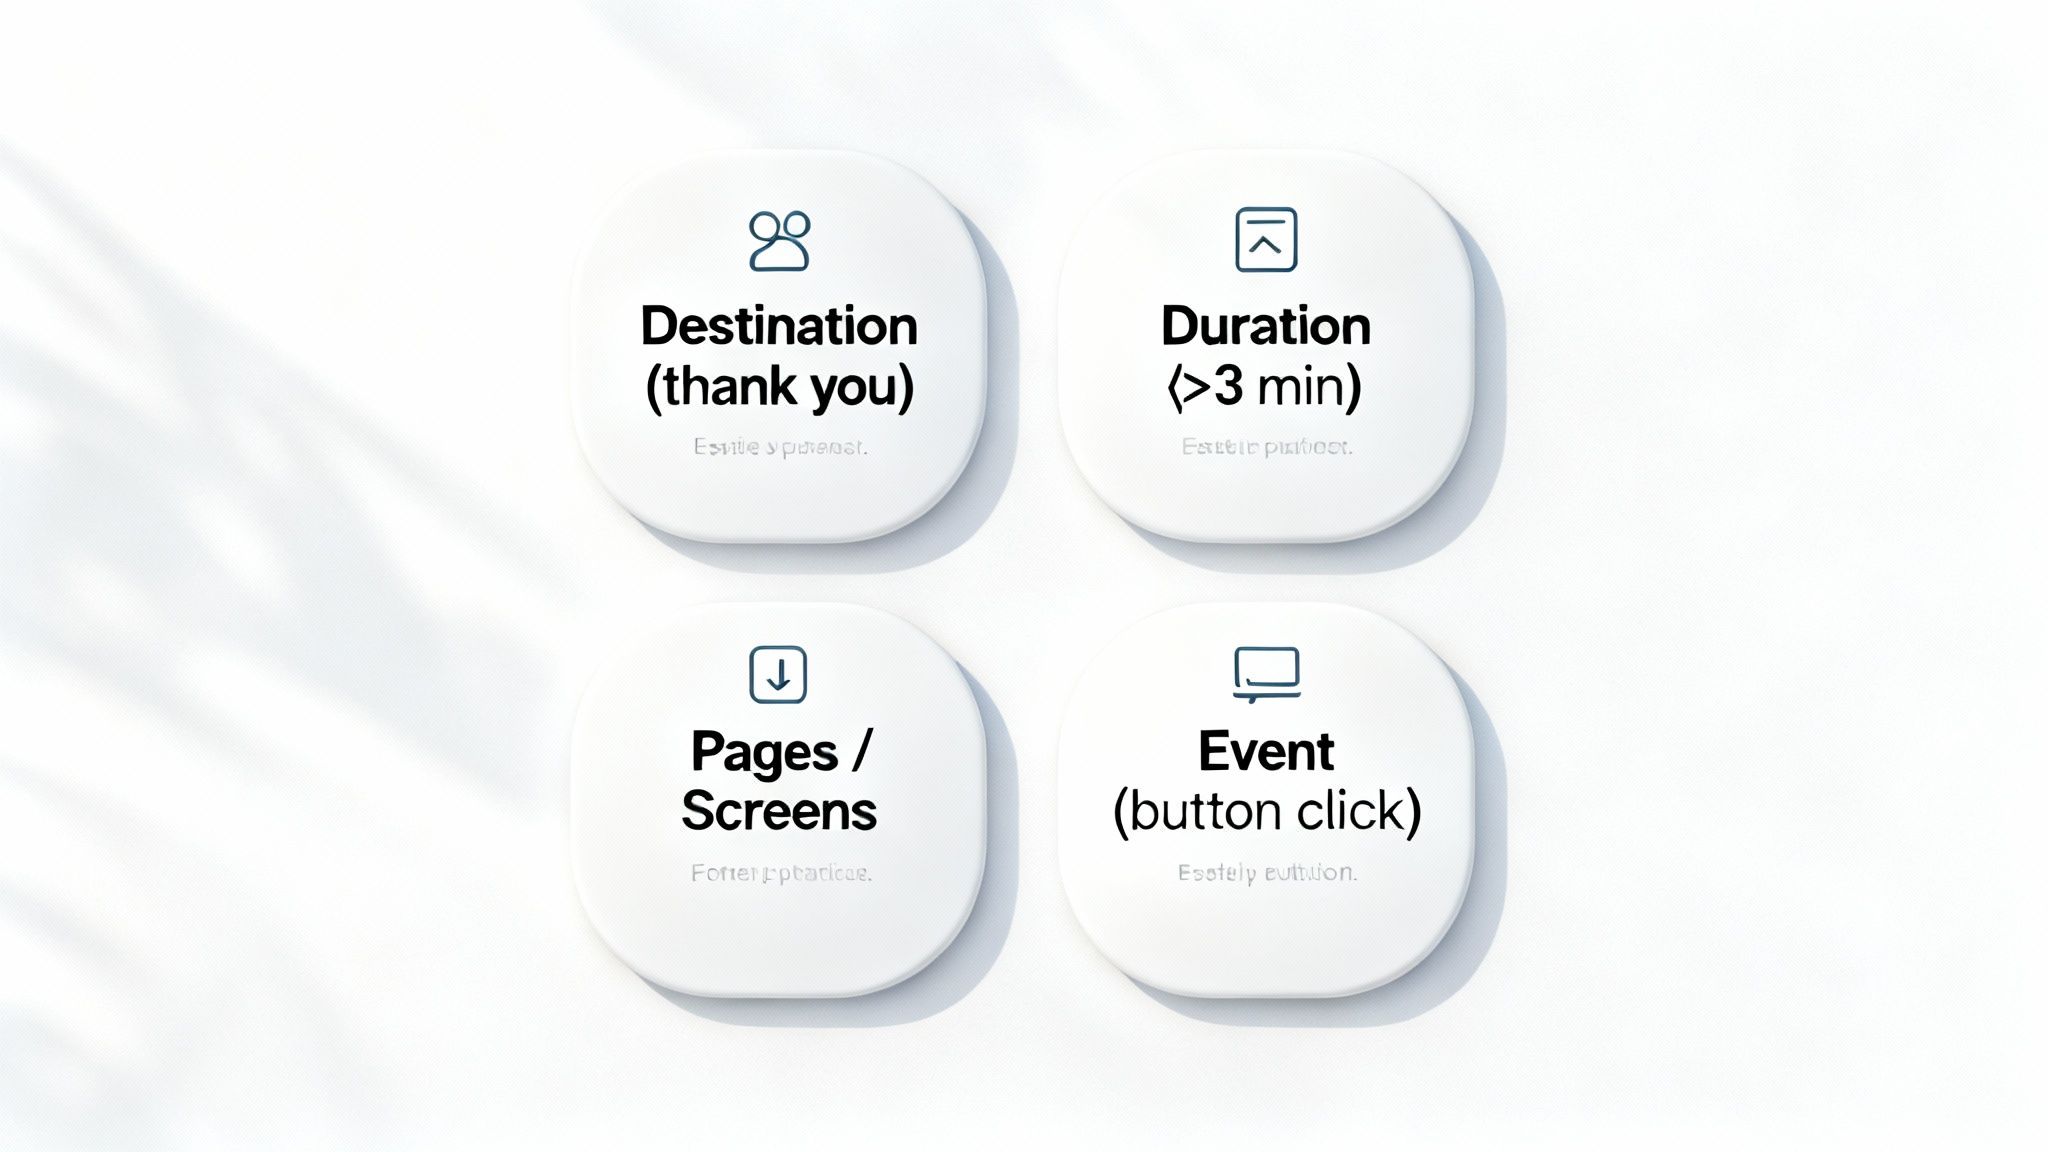
Universal Analytics is shut down, but its goal types are useful context for why GA4’s event model is a leap forward. Universal Analytics (UA) had a structured, rigid approach to tracking what it called Goals. It offered four specific types, each designed to measure a different kind of user interaction.
Think of these UA Goal types as different kinds of finish lines you could set up on your website. Depending on what you wanted a user to do, you’d choose the finish line that best matched that action. Understanding this classic framework is key to appreciating why GA4’s event-based model is such a significant leap forward.

Destination Goals
This was the classic and most widely understood goal type. A Destination goal was triggered when a user landed on a specific page, such as a "thank you" or confirmation page after submitting a form. For any B2B or professional services firm, this was the cornerstone of lead tracking, straightforward and highly effective for measuring form submissions.
Duration Goals
Duration goals measured engagement by tracking time. You could set a threshold, such as five minutes, and if a user's session exceeded that length, a goal was triggered. This was particularly useful for businesses whose websites serve as deep research tools. For instance, a consulting firm could use it to identify highly engaged prospects spending significant time on detailed case studies or service pages.
Pages Per Session Goals
Similar to Duration, the Pages/Screens per Session goal was another method for measuring visitor investment. Instead of time, it tracked the depth of their visit. You could configure a goal to fire after a user viewed, for example, more than six pages in a single session. A B2B SaaS company could use this to identify users who were thoroughly exploring their product, signaling strong interest.
Event Goals
Finally, Event goals were the most powerful and flexible of the four types. They enabled you to track specific interactions that didn't trigger a new page load, such as clicking a "Download PDF" button, playing a video, or following an external link. While it required additional setup for event tracking, this goal type unlocked a deeper level of measurement and is the direct predecessor of the entire GA4 key-event system. For a detailed breakdown of the mechanics, our guide on how Google Analytics works covers the fundamentals.
These four goal types formed the foundation of conversion tracking for years. Here’s a summary of their application in B2B contexts.
Universal Analytics Goal Types and Business Use Cases
Understanding these distinct "finish lines" from Universal Analytics provides the perfect context for appreciating the shift to GA4's more dynamic and flexible approach to measuring what truly matters to your business.
Why GA4 Replaced Goals with Key Events
The switch from Universal Analytics to Google Analytics 4 was more than an update; it was a complete architectural rebuild. At the heart of this transformation was the move from rigid, session-based 'Goals' to a far more flexible, user-focused model built around 'key events'. Google first called these "conversions," then renamed them to "key events" in 2024.
This change was driven by the need for a truer, more complete picture of the modern customer journey, which is anything but linear.
While Universal Analytics (UA) excelled at tracking straightforward interactions within a single visit, its session-based foundation struggled to connect the dots across a customer's fragmented path.
Moving Beyond the Session
Consider a potential client for a consulting firm. Their journey might look like this:
- Visit 1 (Mobile): They discover a blog post through a Google search on their phone.
- Visit 2 (Desktop): Days later, they recall the company name and navigate directly to the website to view services.
- Visit 3 (Desktop): They see a retargeting ad on LinkedIn, click through, and read a case study.
- Visit 4 (Desktop): A week later, they return to the site and submit a demo request form.
In UA, piecing these four visits together as a single user's story was extremely difficult. It would likely register four separate sessions, making it nearly impossible to attribute the final conversion to the initial blog post. UA saw sessions, not people.
GA4 was built to solve this problem. By treating every interaction, from a page view to a video play, as an event, it can stitch together a user's entire journey across different devices and over several weeks. This provides a much richer and more accurate view, especially for businesses with long sales cycles.
The Power of an Event-Based Model
The core concept in GA4 is simple: everything is an event. In UA, you often had to set up an event and then create a separate goal based on that event, a clunky, two-step process.
With GA4, the process is streamlined. Any event can be flagged as a key event with a single toggle switch. This flexibility lets you track what actually matters to your business, without being boxed in by the four rigid goal types of the past.
This modern approach gives you the granular data needed to optimize your entire funnel and create better user experiences. You're no longer just tracking the finish line; you're tracking every step of the race.
Why This Matters for B2B and Professional Services
For B2B companies, where a "sale" can take months of deliberation, this shift is a game-changer. The user conversion rate metric in GA4 is a perfect example. It divides the number of users who converted by the total number of users. If one of two unique users converts, even across five separate visits, the conversion rate is 50%, a far more meaningful figure than a session-based rate.
The Engagement > Key events report in GA4 provides a clearer view of which channels drive valuable users, and its ability to use a User ID to track people across devices helps piece together those fragmented journeys. For a deeper dive, GA4's user conversion rate provides a clearer picture of this powerful metric.
Ultimately, GA4 didn't just eliminate the goals in Google Analytics feature; it evolved the concept entirely. By replacing a rigid, session-obsessed system with a flexible, user-centric one, Google has provided a tool built for the complex reality of today's digital landscape.
Setting Up Key Events in GA4
Now that you understand why Google Analytics 4 shifted to a flexible, event-based model, it’s time to configure it. Setting up key events in GA4 is far simpler than Universal Analytics. Your primary task is to tell GA4 which of your existing events are important enough to count as key events.
Almost any interaction can be an event, and with a single click, any event can become a key event.
The Two Main Ways to Create Key Events
You have two primary paths for setting up key events, depending on whether the user action is already being collected as an event.
- Mark an Existing Event as a Key Event: This is the easiest route. If GA4 is already capturing an event like
generate_leadorpurchase, you simply flip a switch. - Create a New Event, Then Mark it as a Key Event: If the action isn't a standard event, you can create a custom event directly in the GA4 interface, no code required. This is ideal for tracking specific button clicks or PDF downloads.
Let's walk through both methods.
Method 1: Marking an Existing Event
This should be your first approach for any key action GA4 is already tracking. For instance, many form plugins automatically fire a generate_lead event upon submission.
Here’s how to designate it as a key event:
- Navigate to the Admin section in your GA4 property (the gear icon in the bottom-left corner).
- Under Data display, select Events. This displays a list of all event names GA4 has collected.
- Locate the event you wish to track, such as
generate_lead. - On the far right of that event's row, toggle Mark as key event.
That's it. Within 24-48 hours, GA4 will begin populating your key-event reports with data from that event.
Method 2: Creating a Custom Event and Key Event
What if you need to track something more specific, like a user downloading your company's service brochure? If that action isn't already an event, you can create one directly within GA4.
Let’s imagine the download leads to a thank-you page with "/brochure-download-thanks" in the URL.
- Go to Admin > Data display > Events and click the Create event button.
- Click Create again on the next screen to open the configuration panel.
- Custom event name: Assign a clear, recognizable name. Stick to snake_case (all lowercase with underscores), like
brochure_download. - Set the first condition to
event_nameequalspage_view. - Click Add condition and set the second to
page_locationcontains/brochure-download-thanks. - Click Create in the top-right corner.
Confirm the Event is Firing: Is the underlying event even being tracked? Use GA4's DebugView, found in the Admin panel, to see a real-time feed of events as you interact with your site. This lets you verify your setup is working correctly.
Check the Key-Event Toggle: This is a common oversight. Navigate to Admin > Data display > Key events and ensure the toggle next to your event name is switched on. If it's off, it won't be counted as a key event.
Account for Data Latency: Unlike Universal Analytics, GA4 data processing can take 24 to 48 hours. If you recently implemented tracking, a bit of patience may be all that is required.
Review Data Filters and Thresholding: Check your data filters to ensure you haven't accidentally excluded your key events. Also, be aware that Google applies data thresholding, which can hide data in reports with low user counts to protect privacy. If you’re analyzing a small date range, your key events might be temporarily hidden.
Cross-Domain Tracking: If a user's journey spans multiple domains (e.g., from your main website to a separate booking portal), you must configure cross-domain tracking. Without it, GA4 registers one person as two separate visitors, breaking the session and disrupting conversion attribution.
Referral Spam: Sudden traffic spikes from unknown websites are likely referral spam, which inflates traffic numbers and skews conversion rates. Use the referral exclusion list in your data stream settings to filter out this junk traffic.
Data Discrepancies: It's normal for numbers to differ between platforms due to factors like varying attribution models. Cross-industry conversion rates average around 5.13%, and channel and industry performance varies significantly, which can cause large swings.
- Give It Time: GA4 data can take up to 48 hours to fully process and appear in standard reports.
- Check if the Event is Firing: Use GA4's DebugView to confirm in real-time that the underlying user action is being captured correctly as an event.
- Flip the Switch: This is a common oversight. Go to Admin > Data display > Key events and ensure you have manually toggled the event on to be counted as a key event.
- Look for Filters: Review your property settings to ensure you haven't accidentally configured a data filter that is blocking your key-event data from appearing in reports.
You have now created a custom event. To complete the process, go to Admin > Data display > Key events (or the events list, where the new event may take up to 24 hours to appear), find your new brochure_download event, and toggle it on as a key event. This lets you set up specific goals in Google Analytics 4 without needing a developer.
To take this a step further, our guide on Google Ads conversion tracking can help you sync your analytics and ad campaigns. In Google Ads, these outcomes are still called conversions, which is exactly why GA4 renamed its own version to key events.
A Note on the Goal Migration Tool: GA4 once offered a tool to import old Universal Analytics goals automatically. With UA properties and data now deleted, that tool no longer applies. Build your key events fresh with clean, recognizable names for accurate data.
Analyzing Key-Event Data to Drive Growth
Collecting data is just the starting line. The real value is unlocked when you transform that raw data into a strategic roadmap for growth. Once your key events are firing correctly in Google Analytics 4, you can move beyond simply counting completions to asking smarter questions and turning numbers into business intelligence.
Diving into your GA4 reports helps you understand not just what happened, but why it happened. By uncovering the drivers of user behavior, you can make informed decisions that directly impact your bottom line.
Uncovering Insights in Key GA4 Reports
The Traffic acquisition report is the ideal starting point for understanding which marketing channels deliver your most valuable users. It breaks down traffic sources, like Organic Search, Paid Search, and Direct, and shows how many key events each is responsible for. This insight is crucial. If organic search is driving 80% of your demo requests, you know where to focus your efforts. Conversely, if a paid campaign is generating clicks but few key events, it’s a clear signal to re-evaluate your ad creative or landing page.
Next, the Funnel exploration report in the Explore section serves as a diagnostic tool for the entire customer journey. It allows you to build a visual map of the steps users take on their way to converting and, more importantly, pinpoints where they drop off. Identifying these friction points enables you to make targeted improvements to your website.
Session Rate vs. User Rate: A Critical Distinction
GA4 provides two main conversion rate metrics that tell very different stories. Understanding the distinction is vital, especially for B2B businesses with longer sales cycles.
This table breaks down the key differences between these two critical GA4 metrics, helping you understand when to use each for analyzing your B2B performance.
Session Conversion Rate vs User Conversion Rate
For B2B companies, the user conversion rate is almost always the more meaningful metric. A prospect might visit your site five times over three weeks before finally requesting a quote. A session-based metric would diminish their importance, but a user-based one correctly identifies them as one successfully converted lead. To see how your numbers stack up, check out our guide on what is a good conversion rate.
From Raw Data to SMART Objectives
Ultimately, analyzing your data should lead to setting better, more specific business objectives. It’s about moving from vague wishes to data-backed targets using the SMART (Specific, Measurable, Achievable, Relevant, Time-bound) framework.
Instead of a fuzzy goal like "track more leads," your analysis might empower you to set a SMART objective: "Increase demo-request key events from organic search by 15% within the next quarter."
This clarity provides your team with a clear mission, defining what to do, where to focus, how to measure success, and when to achieve it. This is how you turn analytics from a simple reporting tool into a powerful engine for growth.
Troubleshooting Common Tracking Issues
Even with a meticulous setup, you will eventually encounter data that seems off. When key events suddenly disappear or numbers look skewed, a systematic approach is needed to diagnose the problem and restore confidence in your data. This is your guide to solving the most common issues with goals in Google Analytics 4.
Missing key-event data, discrepancies between platforms, or incorrect attribution can disrupt your entire strategy. Most of these problems stem from a few common, fixable setup errors. Be methodical, starting with the most likely culprits first.
Your Go-To Diagnostic Checklist
If your data looks strange, work through this checklist to isolate and resolve the issue.
Mastering Real-Time Debugging with DebugView
DebugView is your most powerful troubleshooting tool. By enabling it, you can watch the stream of events coming directly from your browser. Click a button or submit a form and see if the configured event appears immediately. You can filter the timeline to focus on your key events, inspect their parameters, and confirm that your rules are triggering as expected. This real-time feedback loop eliminates guesswork and validates your setup on the spot.
When your reports show a 0% conversion rate, it’s easy to blame the campaign. More often than not, a broken tracking setup is the real culprit. Regularly using DebugView ensures your data accurately reflects user behavior, not technical glitches.
Solving More Complex Tracking Problems
Beyond the basics, you might encounter more nuanced issues that can skew your data and lead to poor marketing decisions.
Furthermore, integrating your analytics with a CRM is essential for a complete view of the customer journey, especially post-conversion. To learn more, explore our guide on offline conversion tracking to improve lead quality.
Frequently Asked Questions
Moving from Universal Analytics to Google Analytics 4 can feel like learning a new language. Here are answers to the most common questions to help you navigate the change.
What Is the Main Difference Between a UA Goal and a GA4 Key Event?
The fundamental difference lies in their measurement philosophy. Universal Analytics Goals were primarily session-based and often triggered by a pageview, such as landing on a "thank you" page.
Google Analytics 4 operates on a flexible, event-based model. Any user action, from playing a video to downloading a PDF, can be tracked as an event and designated a key event. This provides a much richer, more comprehensive view of what users are actually doing on your site.
How Many Key Events Can I Set Up in GA4?
GA4 offers significantly more flexibility than its predecessor. While Universal Analytics was limited to 20 goals per reporting view, a standard GA4 property allows for 30 key events. For larger businesses, a Google Analytics 360 property raises this limit to 50 key events per property.
Why Are My Key Events Not Showing Up in GA4 Reports?
Seeing a blank report can be alarming, but the cause is usually straightforward. Before troubleshooting, run through this quick checklist.
Following these steps systematically will resolve the issue in most cases, restoring your access to reliable data.
Ready to transform your analytics from a simple report into a powerful growth engine? The team at Twelverays specializes in building data-driven marketing strategies that deliver measurable results. Discover how we can help you unlock actionable insights and drive real business growth.