
"So, what is a good conversion rate?"
It’s the million-dollar question in digital marketing. The short answer sits between 3-5% for most blended traffic. That is a ballpark. The real answer depends on your industry, traffic source, and specific business goals.
The Simple Answer to a Complex Question

Everyone wants a magic number, a single metric that defines success. The truth is, a universal benchmark doesn't exist. Chasing a generic average is often counterproductive because context is everything.
A good conversion rate isn’t about hitting an arbitrary number from a blog post. It's about consistently outperforming your own past results and keeping pace with direct competitors. Think of it like a marathon: while the world record is impressive, your primary goal is to beat your personal best.
Why Your Industry Defines Your Benchmark
Every industry operates with its own unique dynamics. Customer expectations, sales cycle lengths, and price points vary dramatically, all of which directly influence what constitutes a "good" conversion rate.
For example, an eCommerce store selling low-cost apparel operates in a different universe than a B2B SaaS company with a six-figure annual contract. Comparing their conversion rates is comparing apples to oranges.
Here’s a snapshot of how benchmarks can differ:
- eCommerce: The all-store median sits near 1.4%. A rate above 3.2% puts you in the top 20% of stores. Above 4.7% puts you in the top 10%, and the best verticals clear 6%.
- Paid Search: Campaigns on Google Ads convert higher because user intent runs high. The 2026 average across all industries is 8.18%. It swings from 2.64% in finance and insurance up to 16.22% for animals and pets.
- Platform Specifics: Even the platform matters. Achieving a conversion rate above 3.2% on Shopify, for instance, places you in the top 20% of stores on that platform.
This variability is why layered goals beat a single target. First clear your channel's median. For all-store ecommerce that floor sits near 1.4%. For search traffic it runs higher. Then push for the top quartile. Then chase the top-decile rates the strongest competitors hit. For a deeper view, review the latest Google Ads benchmarks on WordStream.
The Real Goal: Continuous Improvement
Ultimately, the most important benchmark is your own. A "good" conversion rate is one that improves month over month.
A business that improves its conversion rate from 1% to 2% has effectively doubled its lead generation or sales from the same amount of traffic. This is the essence of sustainable growth, making your existing traffic work harder for you.
This mindset shifts the focus from chasing vanity metrics to making small, meaningful gains that drive real business impact. Before diving into industry specifics, let’s ensure we’re measuring performance accurately.
How to Calculate Your Conversion Rate with Confidence
Before you can determine what a "good" conversion rate is, you must be certain you’re measuring your own performance correctly. The formula is simple, but precision is key. If the inputs are wrong, the output is meaningless.
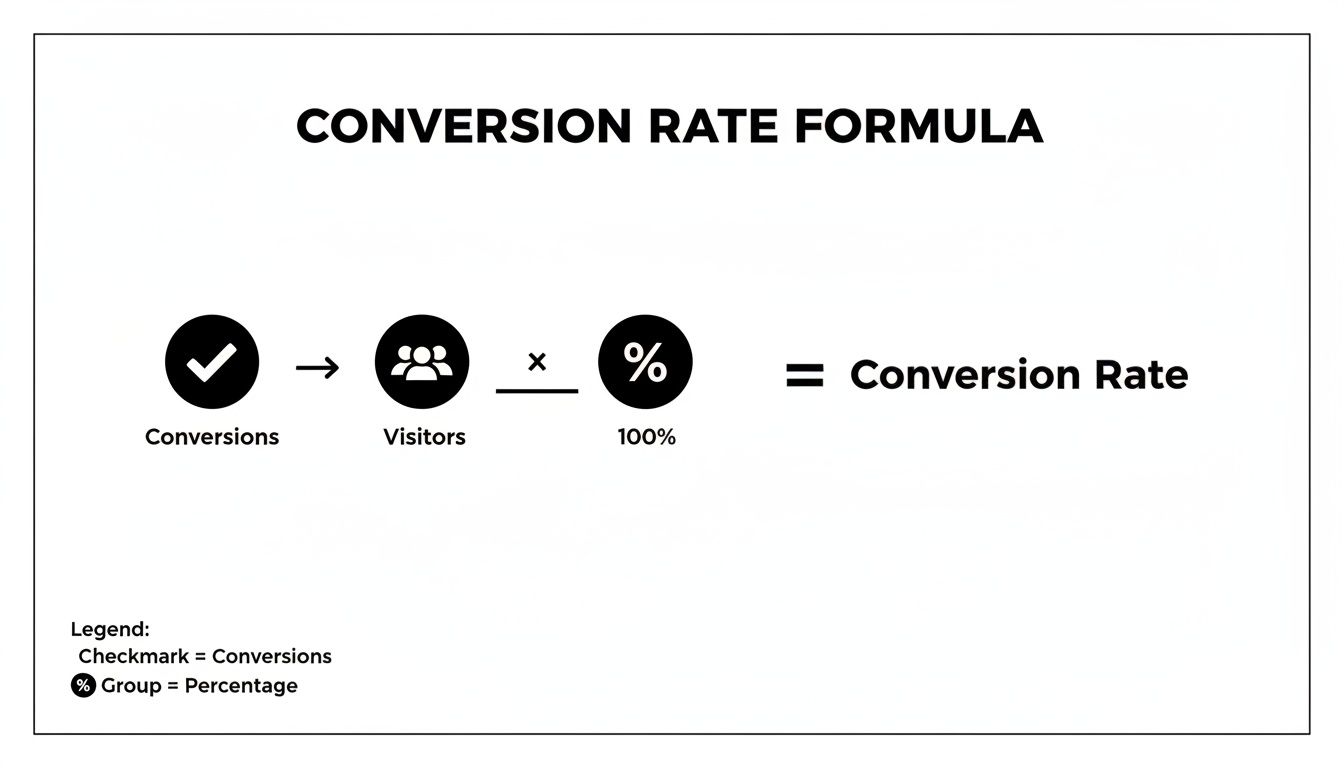
The basic formula is straightforward:
(Total Number of Conversions / Total Number of Visitors) x 100 = Conversion Rate (%)
For example, if a landing page received 2,000 visitors last month and 50 of them signed up for a demo, the conversion rate is 2.5%.
(50 Demo Sign-ups / 2,000 Visitors) x 100 = 2.5%
This provides a baseline. However, accurate measurement hinges on how you define conversions and visitors.
Defining What Actually Counts as a Conversion
A "conversion" is not a universal metric; it's any valuable action you want a user to take on your site. Defining this clearly is the most critical first step.
For an eCommerce store, the primary conversion is a completed purchase. For a B2B SaaS company, it's more likely a demo request or a free trial sign-up. The goal must align with the business model.
Consider what actions truly move the needle for your business. It could be any of the following:
- Making a direct purchase
- Submitting a lead form for a quote
- Downloading a gated resource like an ebook
- Signing up for a newsletter or webinar
- Creating a user account or starting a free trial
Once you've identified your primary conversion goal, set it up within an analytics platform like Google Analytics. This replaces guesswork with reliable, automated data.
Clarifying Who Counts as a Visitor
This is a common point of confusion. Should you count every visit, even from the same person, or only unique individuals? The answer is clear: almost always use unique visitors (or "users" in Google Analytics) instead of total "sessions."
A session is a group of interactions from a single user within a given timeframe. If one person visits your site three times in a week, that’s three sessions but only one unique user. Counting sessions will artificially deflate your conversion rate by counting the same person multiple times.
Focusing on unique users provides a more accurate picture of how effectively you're converting distinct prospects into leads or customers.
With your conversion goals defined and your visitor metric clarified, you can achieve precise, automated measurement. This is especially vital for paid campaigns. To ensure your ad spend is tied directly to results, learn how to master Google Ads conversion tracking in our detailed guide. This is the foundation for making data-driven decisions.
Finding Your Place With Industry and Channel Benchmarks
Asking for a "good" conversion rate without context is like asking for a good score in sports without knowing the game. A great score in basketball looks very different from one in golf. Similarly, a strong performance for your business depends entirely on your industry and the marketing channels you use.
Benchmarks provide the necessary context to evaluate your performance. They help you determine if your results are average, exceptional, or in need of improvement. Without them, you're flying blind, unsure if your 1.5% conversion rate is a failure or a solid starting point for your niche.
Before we explore the numbers, let's revisit the fundamental calculation.
This formula is the universal standard for tracking conversions, enabling fair comparisons across different businesses and marketing channels.
Unpacking eCommerce Conversion Benchmarks
The eCommerce landscape is diverse, so rates range widely. The current all-store median, drawn from Shopify and Littledata benchmark data, sits near 1.4%. The often-quoted "2 to 3% average" actually marks the top-20% threshold, not the middle of the pack.
Aim first to beat your category's median. From there, set stretch goals into the top quartile, which reaches 3.5% to 6%+ in high-performing niches. Pull your own current conversion data by vertical before you set a target.
The type of product you sell heavily influences your potential conversion rate.
- High-Volume, Low-Price Categories: Food and beverage leads every vertical at 6.22%. Beauty and personal care follows at 4.94%. Simple, low-risk purchase decisions drive those higher rates.
- High-Consideration Categories: Luxury and jewelry convert lowest at 0.94%. A longer journey of research, comparison, and deliberation pulls those rates down.
B2B SaaS and Professional Services Averages
In the B2B world, a "conversion" usually signifies the start of a longer sales cycle rather than a direct purchase.
For B2B SaaS companies, the primary conversion is typically a free trial sign-up or a booked demo.
- A solid website conversion rate for these leads generally falls between 2% and 5%.
- However, highly optimized landing pages driven by high-intent paid search ads can often exceed 10%.
For professional services, such as marketing agencies, law firms, or consultants, the conversion is typically a contact form submission or a booked consultation.
A lead conversion rate of 3-5% from website traffic is a strong benchmark for a professional services firm. It indicates that your messaging resonates with the right audience and effectively communicates your value proposition.
Of course, the cost per lead is another critical metric. Understanding how your conversion rate impacts customer acquisition costs is crucial. Our guide on the average cost per lead by industry provides additional B2B context.
How Traffic Channels Influence Your Rate
Where your visitors come from is just as important as who they are. Different marketing channels attract users with varying levels of intent, resulting in vastly different conversion rates. Expecting a Facebook ad to perform like a targeted Google search ad is a recipe for frustration.
To put it all in perspective, here’s a look at how different industries and traffic sources typically perform.
Average Conversion Rates by Industry and Traffic Channel (2026)
This table provides a comparative overview of typical conversion rate benchmarks across key industries and common digital marketing channels, helping businesses set realistic performance targets.
These benchmarks are starting points. Use them to understand your current standing, set realistic goals, and focus on the channels that offer the best return on investment.
The Hidden Forces That Shape Your Conversion Rate
Your conversion rate isn't just a number on a dashboard; it's the outcome of the entire user journey on your website. Understanding the key factors that influence this journey is the first step toward improving it.
While industry benchmarks provide a map, they don’t explain why one site converts well while another struggles. The answer almost always lies in a handful of powerful, interconnected factors that shape the user experience. Get these right, and you turn visitors into customers.
The Critical Role of User Experience
At its core, user experience (UX) is about making your website intuitive, easy, and enjoyable. If a visitor lands on your page and can't immediately understand what to do next, they will leave. It’s the digital equivalent of a clean, well-organized storefront versus a cluttered, confusing one.
Good UX is invisible; it just works. Bad UX creates friction.
- Confusing Navigation: If a visitor can't find your pricing page, they can't become a customer. Your site structure should be logical.
- Poor Readability: Walls of tiny text and low-contrast colors make content hard to digest. Use visuals, short paragraphs, and clear headings.
- Inconsistent Design: An inconsistent visual style erodes trust and makes a site feel unprofessional, reducing the confidence needed for a conversion.
A seamless user journey is a high-converting one. For a more in-depth look, learn how to optimize landing pages in our detailed guide.
Speed and Mobile Friendliness Are Non-Negotiable
Speed is paramount. Every second your page takes to load increases the chance of a visitor leaving. As load times climb, bounce rates climb with them.
Mobile responsiveness matters just as much. The device shapes the rate. Littledata's ecommerce benchmark puts desktop conversion at 1.9% against 1.2% on mobile, a gap that has held steady rather than closed. One-tap payments and better mobile checkout have improved the mobile experience, but desktop still converts meaningfully better.
Mobile now drives 65 to 75% of ecommerce traffic. A mobile-heavy audience pulls your blended rate toward the mobile figure, so know your device mix before you set targets.
Your website is no longer just a desktop experience. A clunky, slow, or difficult-to-navigate mobile site actively turns away the majority of your potential customers.
A fast, mobile-first design isn’t a luxury; it’s a foundational requirement for online success.
The Power of Social Proof and Clear Calls to Action
Even with a perfect user experience, visitors need two final pushes to convert: trust and direction. This is where social proof and your call-to-action (CTA) are essential.
Social proof builds trust by showing that others have had a positive experience with your brand. It's the digital equivalent of a word-of-mouth recommendation.
- Customer Reviews and Testimonials: Authentic feedback from real people is incredibly persuasive.
- Case Studies: Detailed success stories provide in-depth proof of your value.
- Trust Badges: Security seals and industry awards can reassure hesitant buyers.
Finally, after earning their trust, you must tell them exactly what to do next. A vague or hidden CTA kills conversions. Your call-to-action should be unmissable, clear, compelling, and direct. Use action-oriented language like "Get Your Free Demo" or "Buy Now and Save 20%" to create urgency and eliminate any doubt.
Proven Strategies to Turn Clicks into Customers

Knowing your numbers is the first step; improving them is where the real work begins. Enhancing your conversion rate isn't about guesswork. It’s a methodical process called Conversion Rate Optimization (CRO), designed to systematically turn more visitors into customers.
CRO is not a one-time project but a continuous feedback loop: hypothesize, test, analyze, and repeat. This approach transforms optimization from a game of chance into a sustainable engine for growth.
The Art of A/B Testing
At the heart of any solid CRO strategy is A/B testing, also known as split testing. The concept is simple yet powerful: create two versions of a webpage element, like a headline or a CTA button, and show each to a different segment of your audience to see which performs better.
It’s a scientific experiment for your website. By changing only one variable at a time, you can confidently attribute any difference in conversions to that specific change. This data-driven approach replaces assumptions with decisions based on actual user behavior.
Here’s a simple framework to get started:
- Form a Hypothesis: Start with an educated guess, e.g., "Changing our 'Learn More' button to 'Get Your Free Demo' will increase form submissions because it is more specific and action-oriented."
- Create Variations: Build two versions of the page: Version A (the original "control") and Version B (with the new button text).
- Run the Test: Use a testing tool to split traffic evenly between the two versions until you have enough data for a statistically significant result.
- Analyze and Implement: If Version B clearly drives more conversions, make it the new standard. If not, you’ve still gained a valuable lesson about what your audience prefers.
Persuasive Copywriting That Converts
Your website's copy does more than just describe your offerings; its job is to persuade people to act. Every word, from the headline to the button text, influences whether a visitor converts or leaves.
Great conversion copy focuses on the customer's problems and aspirations, not just your product's features. It should be clear, direct, and compelling. Instead of saying, "Our software has advanced analytics," try, "Make smarter decisions with easy-to-read reports that show you what’s really working." The second option speaks directly to a customer benefit.
Key Takeaway: Your copy should build trust and reduce anxiety. Use social proof like testimonials, case studies, and customer logos to show that real people have found success with your brand. This gives potential customers the confidence they need to take the next step.
For more hands-on tactics, our guide on how to improve website conversion rates is packed with actionable strategies you can implement today.
Moving Beyond Averages to Meaningful Growth
After exploring industry benchmarks and optimization strategies, the most important takeaway is this: the only number that truly matters is your own. The goal isn't to hit an arbitrary industry average but to achieve consistent, measurable improvement over your own past performance.
Chasing a universal "good conversion rate" can be misleading. Your most important benchmark is how you performed last month, last quarter, and last year. That is the foundation of a real growth engine.
A business that lifts its conversion rate from 1.5% to 3% has doubled its customer acquisition from the same amount of traffic. This is where small, incremental gains translate into massive business impact.
Tracking Your Progress Over Perfection
To get started, you need a simple way to track your own progress. Focus on a few key metrics and monitor them over time to spot trends and celebrate wins.
Here's a straightforward approach:
- Establish a Baseline: Determine your average conversion rate for the last three months. This is your starting point.
- Set a Realistic Goal: Aim for a specific, incremental improvement. A goal to increase your rate by 10-15% over the next quarter is both ambitious and achievable.
- Track and Analyze: Use your analytics tools to monitor weekly progress. If you see a sudden spike or dip, investigate the cause.
- Iterate and Repeat: Double down on what works and learn from what doesn't. Each cycle refines your approach.
The most powerful shift you can make is from asking "What is a good conversion rate?" to "How can I make my conversion rate better than it was yesterday?" This focus on continuous improvement is the secret to sustainable success.
This process turns optimization from a series of one-off fixes into a core business habit. For example, if you notice an increase in cart abandonment, you can implement specific tactics to recover those sales. For practical tips, learn how to reduce cart abandonment with a few targeted strategies.
Ultimately, a ‘good’ conversion rate is one that is always improving. Your journey starts now, with a clear focus on your own progress, not an unattainable idea of perfection.
Got Questions About Conversion Rates? We've Got Answers.
As you delve into conversion rates, several common questions often arise. Let's address them directly to provide clarity and help you move forward.
How Long Should I Wait to Judge a Conversion Rate?
It's tempting to check your stats daily, but this can lead to premature conclusions. Judging a campaign based on a single day's data is like trying to predict a movie's plot from its opening scene, you lack sufficient information.
To get a clear picture, you need statistically significant data. A good rule of thumb is to wait until you have at least 100 conversions for each variation in an A/B test. Another practical approach is to let any test or campaign run for a minimum of two full business cycles, such as two weeks, to average out the natural fluctuations in website traffic. This ensures your decisions are based on real trends, not random noise.
Can a High Conversion Rate Ever Be a Bad Thing?
Surprisingly, yes. A high conversion rate can be misleading if it doesn't align with your business goals. The number itself is only part of the story; context is everything.
Imagine a SaaS company achieves a 40% sign-up rate for its free trial. On the surface, this looks fantastic. But what if only 1% of those users ever upgrade to a paid plan? That impressive conversion rate is actually a warning sign. It might indicate that you're attracting users with no intent to buy, which drains support resources and clogs the sales pipeline with unqualified leads.
Key Insight: Never analyze conversion rates in isolation. Always pair them with business health metrics like Customer Lifetime Value (CLV) and Return on Investment (ROI). A lower conversion rate that brings in high-value customers is always superior to a high rate that attracts low-quality leads.
What Is the Difference Between Macro and Micro Conversions?
Understanding the distinction between macro and micro conversions is crucial for seeing the entire customer journey, not just the final outcome.
- Macro Conversions are the primary goals that directly impact your bottom line. These include actions like completing a purchase, requesting a quote, or signing up for a paid subscription.
- Micro Conversions are the smaller, incremental steps a user takes on their path to a macro conversion. These actions signal interest and engagement.
Examples of micro conversions include downloading an ebook, watching a demo video, adding an item to a cart, or subscribing to a newsletter. Tracking these smaller wins is vital. They show you where your funnel is effective and, more importantly, where users might be encountering friction or dropping off.
Where Should I Start with Optimization on a Limited Budget?
You don't need a large budget to achieve significant results. The key is to focus your efforts on "low-hanging fruit", the areas with the greatest potential for improvement.
Start by analyzing your website data. Look for pages that receive high traffic but have poor performance, such as a high bounce rate or a low conversion rate. These pages are prime candidates for quick wins.
From there, focus on simple, high-impact A/B tests that cost nothing to implement:
- Test your headlines: Compare a benefit-driven headline against a feature-focused one.
- Experiment with your CTA: Change the button text ("Get Started" vs. "Claim Your Free Trial"), adjust the color, or move its position.
- Simplify your forms: Each field you remove reduces friction. Try cutting one or two fields and measure the impact.
Another powerful, cost-free tactic is to simply ask your customers for feedback. On-page surveys or polls can provide invaluable insights into what's preventing visitors from converting, directly from the source.
Ready to move from chasing averages to driving real business growth? At Twelverays, we specialize in creating data-driven digital marketing strategies that focus on what matters most, your conversions and revenue. Let's build a strategy that delivers results.