
Measuring digital marketing performance is about connecting your marketing efforts to tangible business results. It requires moving past superficial numbers to focus on what truly drives growth: setting revenue-focused goals and tracking the right key performance indicators (KPIs) to monitor progress.
Moving Beyond Vanity Metrics to Revenue-Focused Goals
It's a common scenario: a huge spike in website traffic or a viral social media post generates excitement, but the sales report shows no impact. This disconnect often stems from a focus on vanity metrics: numbers that look impressive but offer little insight into business health.
Effective performance measurement begins with a strategic shift. It's about directly tying every campaign to the bottom line.
Instead of asking, "How many impressions did our ad get?" the critical question is, "How many qualified leads did that ad generate, and what was the cost per lead?" This approach demonstrates marketing's true value to leadership and secures its role as a revenue driver.
The Problem with Vanity Metrics
Metrics like page views, social media likes, and follower counts are easy to track and often paint a positive picture, making them tempting to focus on. However, they lack context and rarely correlate with profitability.
A blog post might attract 100,000 visitors, but if none sign up for a demo or become customers, has it truly benefited the business?
Chasing these numbers can misdirect your budget toward channels that deliver high traffic but zero quality leads. The objective is to build a measurement framework around metrics with a clear, direct link to business growth.
Vanity Metrics vs. Actionable KPIs
Distinguishing between feel-good metrics and those that inform strategy is essential. This comparison highlights where your focus should be.
Concentrating on the "Actionable KPI" column is what transforms a marketing team from a cost center into a revenue-driving engine. These are the numbers that tell a compelling story of business impact.
Defining Revenue-Aligned Objectives
Your first step is to translate high-level business goals into specific, measurable marketing objectives. If the company aims to increase annual recurring revenue (ARR) by 20%, the marketing team must define its precise contribution.
This process isn't about guesswork; it's about reverse-engineering the revenue target into marketing KPIs.
For example, your objectives could be:
- Generate 500 new Marketing Qualified Leads (MQLs) per quarter.
- Achieve a $50 Cost Per Acquisition (CPA) for new demo requests.
- Increase the lead-to-customer conversion rate from 3% to 5%.
Each of these goals ties directly to revenue, making performance transparent. For a B2B SaaS company, this might mean driving more trial sign-ups. For a professional services firm, the focus could be on booking initial consultations.
A common mistake is treating all leads equally. A revenue-aligned approach differentiates between a casual newsletter subscriber and someone submitting a "Request a Demo" form. The latter has significantly higher purchase intent, and your measurement must reflect this distinction.
This mindset aligns with current industry trends. Success today is measured by conversion rates and Customer Acquisition Cost (CAC). In fact, 41% of marketers report that sales generated is the primary metric for judging content success. The era of celebrating traffic for its own sake is over.
Connecting Funnel Stages to Actionable KPIs
With clear objectives, you can assign specific KPIs to each stage of your marketing funnel. This creates a roadmap from initial brand awareness to a signed contract, ensuring every touchpoint is measured meaningfully.
For a deeper dive, explore our comprehensive guide on marketing KPI examples that details this process.
This structured approach transforms marketing analytics from a historical report into a forward-looking tool that guides strategy and proves ROI.
Building Your Data and Tracking Infrastructure
You can't measure what you don't track. Without a solid data infrastructure, your analysis will be unreliable. Setting this up correctly ensures your data is clean, connected, and trustworthy from the start.
Think of this as creating your marketing's central nervous system, a unified system capturing the entire customer journey. It's the technical backbone that allows you to move beyond isolated data points to a cohesive, revenue-focused narrative.
This visual captures the core philosophy: start with clear goals, define the KPIs that measure progress, and tie everything back to revenue.
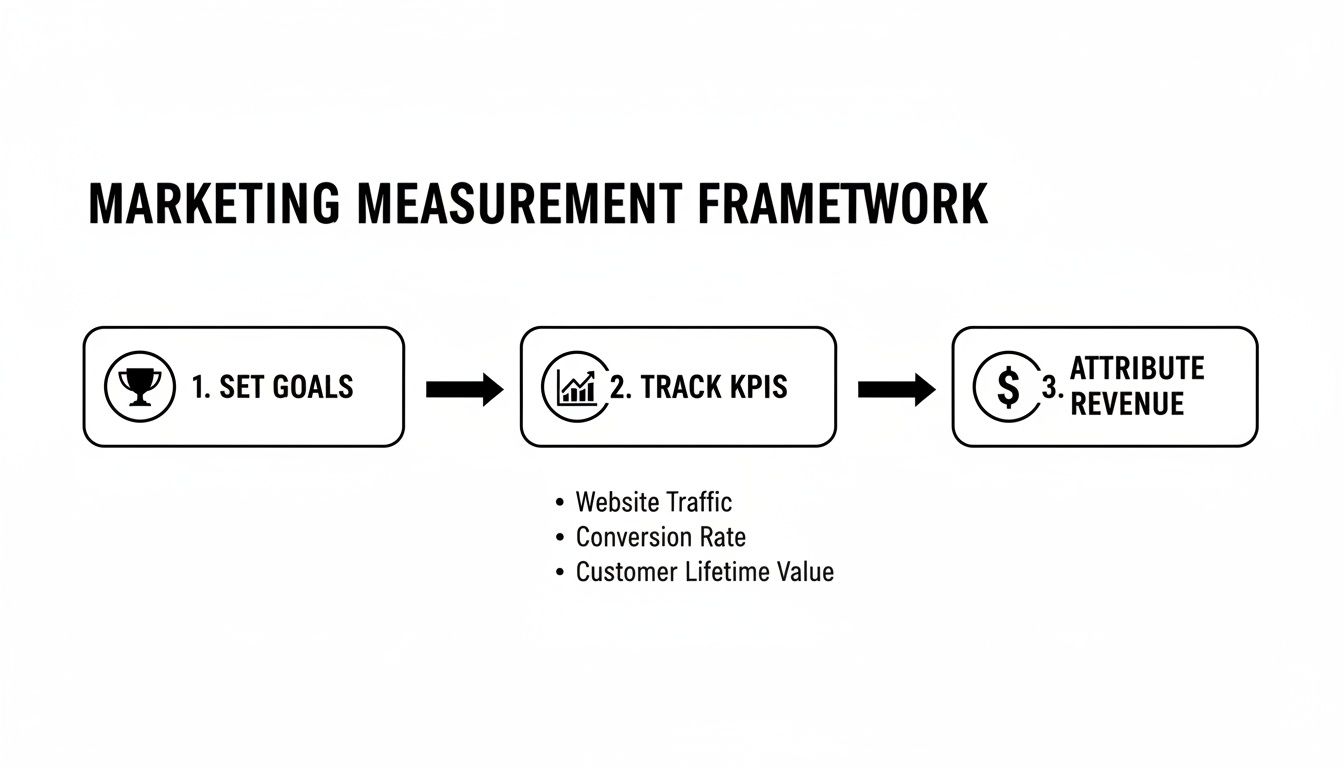
This framework is a linear process where each step builds on the last, ensuring marketing activities remain consistently aligned with business outcomes.
Mastering Your Core Analytics and Tagging Tools
The foundation of your infrastructure is understanding user behavior on your website. Google Analytics 4 (GA4) is the industry standard, an event-based platform designed to track user interactions with greater flexibility, making it ideal for modern, non-linear customer journeys.
A critical best practice is to avoid implementing tracking scripts directly into your website's code. Instead, use Google Tag Manager (GTM). GTM acts as a container for all your marketing and analytics tags (e.g., GA4, Facebook Pixel, LinkedIn Insight Tag).
Using GTM provides two significant advantages:
- Agility: Add, edit, or remove tracking scripts without developer assistance. Marketing teams can deploy campaign tracking in minutes, not weeks.
- Consistency: Centralizing tags reduces the risk of broken code or duplicate scripts that can corrupt your data.
A common mistake is setting up GA4 without GTM. While functional, it limits your ability to scale tracking and often leads to messy, unreliable data.
Pro Tip: Standardize your event naming conventions in GTM from day one. Vague names like "click" or "submit" are useless. Use a clear, descriptive structure like
form_submit_demo_requestorcta_click_header_contact. Clean data begins with clean implementation.
Creating a Closed-Loop System with CRM Integration
For B2B and professional services firms, website data is only part of the story. The key is connecting marketing activities to sales outcomes. This requires integrating your marketing platforms with your Customer Relationship Management (CRM) system, such as Salesforce or Dynamics 365.
This integration creates a closed-loop reporting system. It passes lead data from marketing channels into your CRM and, crucially, passes sales data back.
Here's how it works when a lead completes a website form:
- The conversion event is captured in GA4 and attributed to the specific marketing campaign.
- The lead’s information, along with hidden fields containing source, medium, and campaign data, is sent to your CRM.
- When the sales team closes the deal weeks or months later, the revenue is tied directly back to the original marketing touchpoint.
This connection is fundamental to truly measuring digital marketing performance against revenue. It answers the ultimate question: "How much revenue did our Q2 LinkedIn campaign generate?" Without it, marketers are merely guessing their ROI.
Once this tracking is in place, you can get more granular by setting up specific goals in Google Analytics to monitor your most valuable conversions.
Choosing the Right Attribution Model for Your Business
With your tracking infrastructure established, the next critical question is: which marketing touchpoint gets credit for a conversion?
This is the core of marketing attribution.
Without a suitable attribution model, you risk investing in channels that appear effective but don't actually drive results. It's the difference between confidently allocating budget and guessing where your best customers originate.
The ideal model depends on your business. A B2B firm with a six-month sales cycle needs a different approach than an e-commerce store with a two-day purchase window.
Common Attribution Models Explained
Choosing a model isn't about finding one perfect answer but selecting the one that best reflects your customer's buying process. Each model tells a different story about what influences a decision.
Here's a breakdown of common models:
Last-Touch Attribution: The default for many platforms, this model gives 100% of the credit to the final touchpoint before conversion. It's useful for businesses with short sales cycles where the last click is most decisive.
First-Touch Attribution: The opposite of last-touch, this model credits the very first interaction. It’s excellent for identifying which top-of-funnel channels are most effective at generating initial awareness.
Linear Attribution: This model distributes credit equally across every touchpoint in the journey. While it acknowledges multiple interactions, its drawback is treating a brief social media view the same as an in-depth demo request.
Time-Decay Attribution: A more sophisticated multi-touch model that gives more credit to interactions closer to the conversion. This is ideal for longer sales cycles where a recent action, like booking a consultation, is more impactful than a blog post read three months prior.
A significant mistake is sticking with Last-Touch attribution simply because it's the default. It systematically undervalues the crucial awareness and consideration-stage marketing that precedes the final click. This can lead you to believe paid search is your only high-performer, when in reality, a blog post and a webinar did the foundational work.
Selecting a Model That Aligns with Your Strategy
For most B2B and professional services firms, single-touch models are insufficient. The customer journey is rarely a straight line; it's a complex path of engagements over weeks or months. This makes multi-touch attribution essential for accurately measuring digital marketing performance.
In the B2B world, early engagement metrics are powerful leading indicators of future revenue. A multi-touch model properly values initial interactions, like video views or campaign clicks, that eventually lead to sales, providing a clearer picture of what's truly working.
Ultimately, the goal is to move toward a Data-Driven Attribution (DDA) model, available in platforms like Google Analytics 4. DDA uses machine learning to analyze conversion paths and assign credit based on which touchpoints are statistically most likely to lead to a conversion, removing guesswork and offering the most accurate view of channel performance.
For a more detailed explanation, read our article on what marketing attribution is and how it works. Selecting the right model ensures your budget decisions are based on the complete customer story, not just the final chapter.
Weaving Data Into Actionable Dashboards and Reports
Raw data is overwhelming; clear, visual dashboards are powerful. Once your tracking and attribution model are in place, the next step is to transform that information into actionable insights. This involves moving from complex spreadsheets to intuitive visual stories that guide your strategy.
The goal is to create a single source of truth, a centralized view of your most important KPIs. This helps everyone, from the CEO to the marketing team, quickly understand performance, spot trends, and make informed decisions.
Designing Dashboards That Tell a Story
A great dashboard answers your most pressing business questions at a glance. Before opening a tool like Data Studio, you must decide what story to tell and for whom.
Your CEO doesn't need to see the click-through rate of a specific ad. They need high-level answers to questions like:
- What is our marketing ROI this quarter?
- What is the trend for our customer acquisition cost?
- Which channels are driving the most revenue?
In contrast, your PPC specialist needs granular data, focusing on metrics like Cost Per Click (CPC), Conversion Rate by campaign, and Return on Ad Spend (ROAS) for real-time optimization.
The most effective dashboards are built top-down. Start with the big-picture outcome, revenue or MQLs, at the top. Then, allow users to drill down into the channels and campaigns that contributed to that result. This structure directly connects daily marketing activities to bottom-line impact.
Here is an excellent example of a high-level performance dashboard that is clean, visual, and direct.

This layout allows anyone to quickly assess what’s working and what requires further investigation.
Choosing the Right Visualizations for Your KPIs
The way you visualize data can make or break a report. The right chart reveals game-changing insights, while the wrong one obscures them.
Here are a few practical guidelines:
- Scorecards: Use for single, critical numbers like Total Revenue, Total MQLs, or Overall Conversion Rate to provide an immediate snapshot of current performance.
- Time-Series Line Charts: Ideal for showing how a metric changes over time. Track trends in Website Traffic, Cost Per Lead, or Monthly Recurring Revenue (MRR).
- Bar Charts: Best for comparing performance across different categories, such as Leads by Channel or Revenue by Campaign.
- Pie or Donut Charts: Use sparingly to show the composition of a whole, like the percentage of traffic from each source. Keep segments minimal to avoid clutter.
Thoughtful chart selection makes your dashboard intuitive and informative. For inspiration, check out our resource with several powerful marketing dashboard examples.
Establishing a Reporting Rhythm and Culture
Building a dashboard is only the beginning. True value comes from integrating it into your team's workflow, fostering a data-driven culture. This starts with a consistent reporting rhythm.
Global ad spend passes $1 trillion for the first time in 2026, with digital growing in the mid-to-high single digits, per Dentsu's December 2025 forecast. The pressure to prove value is immense. Marketers are rightly shifting focus from vanity metrics to impactful KPIs like click-through rates (CTR) and return on ad spend (ROAS).
A solid reporting cadence might look like this:
- Daily Checks: A quick scan of campaign-specific metrics like ad spend and CPC, primarily for campaign managers.
- Weekly Reviews: Team meetings to discuss channel performance, lead volume, and MQL quality to keep everyone aligned and identify issues early.
- Monthly Reports: In-depth analysis for leadership, focusing on ROI, CAC, and progress toward quarterly goals.
This structure ensures everyone, from practitioner to executive, operates from the same playbook, transforming your measurement framework into a powerful engine for growth.
Turning Insights Into Optimization and Growth
Measurement without action is pointless. After setting up tracking, choosing an attribution model, and building insightful dashboards, it's time to close the loop. This is where the hard work of measuring digital marketing performance translates into higher ROI and sustainable business growth. Raw data becomes your tool for intelligent optimization.
This is a systematic process of continuous improvement: analyze data to find opportunities, form a clear hypothesis, run a controlled test, and implement the winning variation. This cycle drives a high-performing marketing function.

From Analysis to Hypothesis
Your optimization journey starts with your dashboards. Look beyond top-line numbers for patterns, anomalies, and underperforming areas. Dig into segments to uncover the deeper story.
For example, you might see a lead generation campaign producing many MQLs but a low final lead-to-customer conversion rate. This is your starting point. The data is a signpost pointing to a problem.
From this observation, craft a specific, testable hypothesis. Instead of a vague goal like "get better leads," a strong hypothesis is: "Our landing page messaging is attracting a broad audience but isn't qualifying them effectively. By changing the headline to target a specific job title and a more acute pain point, we can increase the lead-to-customer conversion rate by 15% because the leads will be a better fit for our sales team."
This hypothesis is clear, measurable, and directly addresses the issue identified in your data.
A common pitfall is jumping from data to a "solution" without a clear hypothesis. A hypothesis forces discipline by making you articulate what you're changing, why you believe it will work, and the expected outcome. It turns a random guess into a scientific experiment.
Running Controlled A/B Tests
With a solid hypothesis, it's time to test it. A/B testing is the standard. You create two versions of an asset, a control (Version A) and a variation (Version B), and show them to different audience segments to see which performs better against your goal.
Successful A/B testing requires control and statistical significance. Only change one variable at a time. If you alter the headline, CTA button color, and main image simultaneously, you won't know which element caused the change.
Here's a simple framework for running A/B tests on your B2B campaigns.
A/B Testing Framework for B2B Campaigns
This structured approach ensures every change is a calculated move, leading to consistent, data-backed improvements.
Real-World Optimization Scenarios
This framework applies to all your digital marketing channels. Here are a few practical examples of how data-driven insights can lead to tangible improvements.
Optimizing Ad Spend with ROAS Data: You review your paid search campaigns and find one ad group has a Return on Ad Spend (ROAS) of 8:1, while another is at 2:1. The insight is clear: reallocate budget from the underperformer to the high-ROAS ad group to maximize overall return. For a deeper dive, read our guide on how to calculate Return on Ad Spend.
Refining Landing Pages with Heatmaps: Tools like Hotjar or Crazy Egg show where users click and scroll. If you see that few users scroll to your main call-to-action (CTA), you might hypothesize that moving the CTA "above the fold" will increase clicks. You run the test and observe the results.
Improving Content Strategy with Engagement Metrics: In Google Analytics, you find that blog posts on a niche topic have a 25% higher MQL conversion rate than broader content. This insight reveals what your most valuable prospects care about, guiding your content calendar to focus on topics that directly generate qualified leads.
This continuous loop of analysis, hypothesis, testing, and implementation separates a stagnant marketing department from a true growth engine, ensuring every decision is backed by data.
Common Questions on Marketing Performance
Even with a solid framework, questions will arise. Addressing the details is what elevates a good measurement strategy to one that drives growth.
Here are answers to some of the most common questions.
How Often Should I Review My Marketing KPIs?
There's no single answer. The right reporting frequency depends on the metric and the audience. Reviewing everything on the same schedule leads to overwhelm and inaction.
Consider a layered approach. For a typical B2B or professional services firm, a practical cadence is:
- Daily or Every Other Day: For campaign managers watching fast-moving metrics like ad spend, Cost Per Click (CPC), and impressions. This allows for quick adjustments to prevent budget waste.
- Weekly: For team check-ins focusing on leading indicators like website traffic, Marketing Qualified Leads (MQLs), and channel conversion rates. This is ideal for spotting trends and keeping the team aligned.
- Monthly or Quarterly: For leadership discussions centered on bottom-line metrics like Customer Acquisition Cost (CAC), Return on Ad Spend (ROAS), and overall marketing ROI. These numbers guide major budget and strategy decisions.
A classic mistake is treating every metric with equal urgency. Your CEO doesn't need daily updates on social media engagement. A tiered reporting schedule delivers the right information to the right people at the right time, making the data far more useful.
What Are the Best Tools for a Small B2B Company to Start With?
You don't need an expensive, complex tech stack to measure performance effectively. For a small B2B company, focus on building a solid, affordable foundation first.
Here’s a lean yet powerful starter kit:
- Google Analytics 4 (GA4): This is non-negotiable and free. It’s the core of your web analytics, providing data on user behavior, conversions, and traffic sources.
- Google Tag Manager (GTM): Also free, GTM is your command center for all tracking scripts. It enables you to make changes without developer help, keeping you nimble and your data clean.
- Data Studio (Google's free reporting tool, renamed back from Looker Studio in April 2026): This free tool pulls data from GA4 and other sources into easy-to-read dashboards, perfect for creating high-level reports for stakeholders.
- A CRM (Free or Starter Tier): You need to track what happens after a lead is generated. Many CRMs like HubSpot offer free or low-cost plans that are sufficient to start. This piece connects marketing activity to sales.
This simple four-part stack provides everything needed to track the entire customer journey, from first click to signed contract.
How Do I Measure Offline Conversions From Digital Marketing?
This is critical for many businesses, especially in professional services where valuable conversions like phone calls or consultations happen offline. Connecting these real-world events to your digital efforts is essential for a complete picture.
This is more straightforward than it sounds. You just need to build bridges between your online and offline worlds.
- Dedicated Phone Numbers: Use a call tracking tool (like CallRail) to assign unique, trackable phone numbers to each digital campaign. When someone calls the number from your Google Ads landing page, the system logs it, attributing the call to the correct ad.
- Unique Promo Codes or Offers: Create specific codes for different channels (e.g., "PODCAST20"). When a new client uses that code during an offline consultation, you can directly attribute that business to your podcast advertising.
These methods close the attribution loop, ensuring you give credit to the channels driving your most valuable offline actions.
Ready to stop guessing and start building a measurement strategy that ties every marketing action to real revenue? Twelverays builds performance frameworks specifically for B2B firms and professional services. We'll help you integrate your CRM, create dashboards you'll actually use, and turn your data into demonstrable ROI.
See how we can transform your marketing performance at Twelverays