
Key Takeaways
- How to measure website traffic is the process of tracking sessions, users, engagement, and conversions through a platform like Google Analytics 4, then segmenting that data by channel and device to find what actually drives revenue.
- A website traffic checker is a third-party estimator, such as Similarweb, Ahrefs, or Semrush, that models a site's traffic from clickstream panels and search-ranking data when you don't have access to its real analytics account.
- To check website traffic on your own site, install GA4 or a privacy-first alternative (Matomo, Fathom, Plausible) and track engagement rate and conversion rate together, not pageviews alone.
- How to find website traffic for a competitor is a matter of cross-referencing at least two independent estimators, since no third-party tool has direct access to another site's server logs.
- Organic search is still the single largest traffic channel worldwide: it generated more than 1 trillion visits industry-wide in 2025 (Semrush).
- Mobile devices generated just over 52% of global web traffic in Q1 2026 (StatCounter via Statista), so segment every metric by device before drawing conclusions.
Understanding your website's performance begins with a crucial first step: installing an analytics tool. A platform like Google Analytics is the industry standard, tracking user interactions on your site to provide key metrics such as sessions, users, and traffic sources. This data is the foundation for comprehending audience behavior and gauging the effectiveness of your marketing strategies.
Why Measuring Your Website Traffic Is Crucial for Growth
Knowing how to measure website traffic is far more than observing fluctuating numbers on a dashboard; it's the bedrock of informed business strategy. Without accurate data, every decision regarding your website, from content creation to marketing spend, is essentially a guess.
By delving into your analytics, you can move beyond superficial "vanity metrics" like raw pageviews and start answering the critical questions that directly impact your bottom line.
Pinpoint Your Most Valuable Channels
Consider a real-world scenario: an e-commerce business analyzes its traffic and discovers that visitors arriving from a specific industry blog convert at twice the rate of any other source. This insight is invaluable.
It provides a clear directive on where to focus marketing efforts, perhaps by sponsoring content on that blog or cultivating a deeper partnership. The goal isn't just to attract more traffic; it's about attracting the right traffic. Measuring your website enables you to identify and prioritize the channels that deliver actual customers.
Measuring traffic helps you understand the story behind your numbers. It reveals which marketing channels are your star players and which are underperforming, allowing you to allocate your budget with confidence and precision.
Enhance the User Journey
Traffic data offers a window into the user's experience, revealing precisely where they encounter difficulties.
Are a significant number of mobile users abandoning their carts at the checkout page? This is a strong indicator that your mobile payment process may be cumbersome or malfunctioning. Are visitors from organic search leaving a landing page almost immediately? The content likely doesn't align with their search query.
By identifying these patterns, you can pinpoint friction points and implement targeted improvements. This data-driven approach fosters a superior user experience, which in turn boosts engagement, increases conversions, and builds lasting brand loyalty. Ultimately, measuring traffic is a core business function that empowers you to make informed decisions that fuel sustainable growth.
Website Traffic Checker Options: Choosing Your Analytics Toolkit
Selecting the right analytics tool is the first, and arguably most important, step in measuring your website traffic. Your choice will define the depth of your insights and your ability to act on them. It is vital to find a platform that aligns with your business goals, technical expertise, and privacy standards.
The market has evolved beyond a one-size-fits-all solution. For many, the journey starts with Google Analytics 4 (GA4). As the industry heavyweight, it provides incredibly detailed, granular data at no cost. Its event-based model represents a significant evolution from traditional analytics, focusing on user actions rather than simple page views. This means every click, scroll, and form submission can be tracked as a distinct event, creating a much richer narrative of user interaction. If you're new to the platform, understanding how Google Analytics works is an excellent first step.
Beyond the Default Google Analytics
While GA4 is exceptionally powerful, its complexity can be a significant barrier for some. Furthermore, growing concerns about data privacy have spurred the development of several excellent alternatives.
If data ownership and user privacy are non-negotiable for your organization, a self-hosted platform like Matomo is a strong contender. It grants you 100% data ownership, ensuring you are not sharing user information with third-party technology companies.
Alternatively, if your priority is simplicity and direct access to essential metrics, tools such as Fathom and Plausible are gaining popularity for good reason.
- Fathom Analytics: This tool is designed for speed and simplicity, offering a single, clean dashboard with core metrics and intentionally avoiding the data overload common in more complex platforms.
- Plausible Analytics: A lightweight, open-source alternative that focuses on essential insights without using cookies, making it an ideal choice for privacy-conscious site owners seeking straightforward traffic analysis.
The best analytics tool isn’t the one with the most features. It’s the one that gives you clear, actionable answers to your most important business questions without getting in your way.
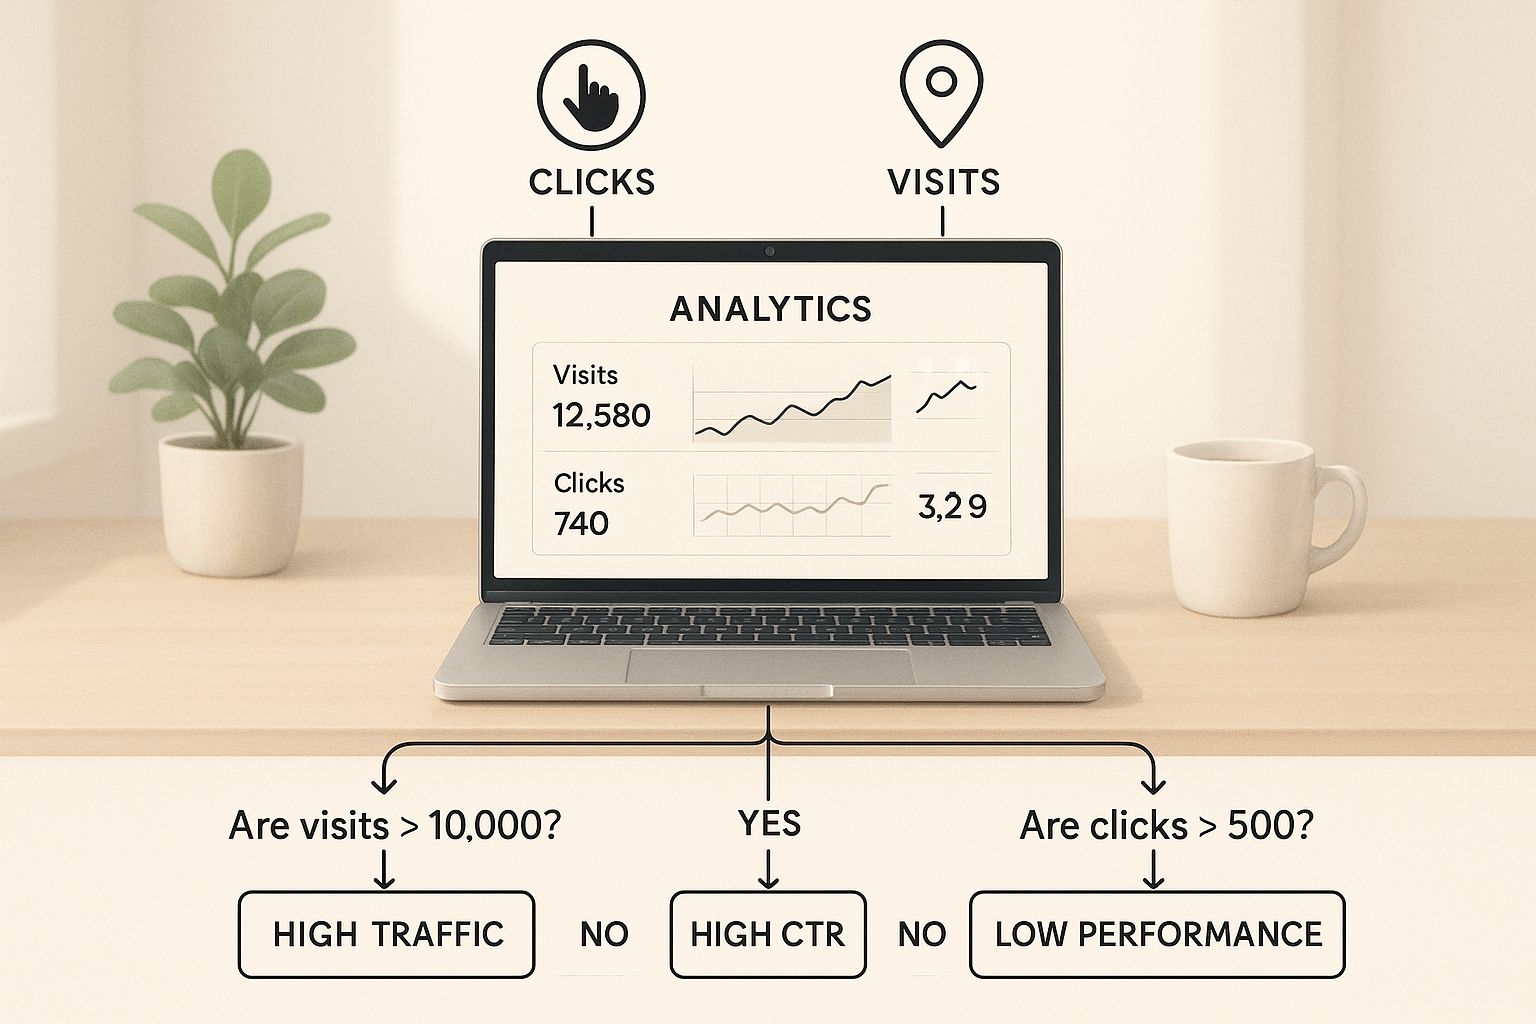
The image below illustrates how a well-designed tool can present key data on a clean, modern dashboard.
This kind of visualization demonstrates how the right platform can distill complex visitor data into an intuitive interface, making it much easier to spot trends at a glance.
Comparing Top Web Analytics Tools
To help you make an informed decision, this table breaks down the key features and ideal use cases for some of the most popular analytics platforms available today.
| Tool | Best For | Key Feature | Pricing Model |
|---|---|---|---|
| Google Analytics 4 | Businesses needing deep, free, and comprehensive cross-platform tracking. | Advanced event-based tracking and machine learning insights. | Free |
| Matomo | Organizations prioritizing data privacy and full ownership of their analytics data. | 100% data ownership with on-premise or cloud hosting options. | Freemium (Cloud & On-Premise) |
| Fathom | Solopreneurs and small businesses wanting simple, privacy-first analytics. | Single-page dashboard with essential metrics and no cookies. | Subscription-based |
| Plausible | Privacy-conscious businesses looking for a lightweight, open-source solution. | Cookie-free tracking and a simple, intuitive user interface. | Subscription-based |
Ultimately, the best tool is the one that fits your specific needs. There's no single "right" answer, only what's right for your business right now.
Making the Right Choice for Your Business
Your decision should come down to a few key questions:
- What questions do I need to answer? Are you trying to track complex user journeys across both your app and website (GA4)? Or do you just need to know your top pages and where your traffic is coming from (Fathom/Plausible)?
- How important is data privacy? If you handle sensitive user data or operate in a region with strict laws like GDPR, a privacy-focused tool like Matomo or Plausible is a much safer bet.
- What’s my technical comfort level? Are you comfortable digging into a feature-rich, complex interface, or do you prefer a simple solution that works right out of the box?
Answering these questions honestly will guide you to a toolkit that doesn't just help you measure website traffic effectively but becomes a genuine asset for growing your business.
How to Check Website Traffic for Any Site, Including Competitors

Every tool covered so far assumes you can install a tracking snippet, which only works on a site you control. Sometimes you need traffic data for a domain you don't own: a competitor sizing up their SEO investment, a prospect account before a sales call, or a potential partner before a co-marketing pitch. That's a different job, and it calls for a website traffic checker instead of first-party analytics.
Website Traffic Checker Tools Worth Trying
Three tools cover most of this need. Similarweb models traffic from clickstream panels and lets you check any competitor's website traffic and engagement, referral sources, and audience overlap side by side. Ahrefs' free Website Traffic Checker estimates search traffic (organic and paid) for any domain or URL from its own keyword-ranking index, and tracks how that estimate has moved across 171 countries. Semrush's Traffic Analytics tool reveals a company's desktop-versus-mobile split, top pages, and traffic journey inside its Traffic & Market Toolkit. A fourth tool, SpyFu, leans PPC-first: it surfaces the paid and organic keywords a competitor buys or ranks for and their estimated ad spend, filling in the "why" behind whatever traffic number the other three tools give you.
How to Find Website Traffic Data When Tools Disagree
Every one of these tools produces a website estimate traffic figure from indirect signals: clickstream panels, DNS-adjacent data, and search rankings, not a copy of the site's real server logs. That means two checkers can disagree on the same domain by a wide margin, especially for smaller or heavily-segmented sites. How to find website traffic numbers you can actually trust is a matter of process, not a single tool: pull the same domain in at least two estimators, weight the trend over the raw total, and treat any single number as directional rather than exact.
How to Find Website Traffic Sources: Understanding Your Core Traffic Channels
Not all visitors arrive at your website through the same path. To truly understand your audience, you must learn how to measure website traffic by segmenting it into distinct channels. Think of each channel as a unique journey people take to find you; analyzing them reveals the story behind your traffic numbers.
This approach moves you beyond simply counting visitors and begins to show which marketing efforts are delivering results. A sudden spike in traffic is encouraging, but knowing it originated from a specific social media campaign provides an actionable insight. Segmenting your traffic is the first step toward making smarter, data-driven decisions.
Decoding the Primary Traffic Sources
Your analytics tool will automatically categorize incoming traffic into several default channels. While the exact labels may vary slightly between platforms like Google Analytics and HubSpot, the core concepts are universal. Understanding these sources is fundamental.
Here are the main channels you will encounter:
- Direct Traffic: This includes anyone who types your URL directly into their browser or uses a bookmark. High direct traffic is often a positive indicator of strong brand recognition and customer loyalty, people already know you and are seeking you out.
- Organic Search: These are visitors who find you through a search on Google, Bing, or another search engine. This channel directly reflects the effectiveness of your SEO strategy. An increase in this number suggests your content is ranking for relevant keywords.
- Paid Search: This channel tracks traffic from paid advertising campaigns on search engines, such as Google Ads. It's an effective way to target specific audiences and generate immediate traffic, but requires careful budget management. Balancing paid and organic efforts is key, and our guide on paid search vs. organic search offers deeper insights into optimizing both.
- Referral Traffic: When someone clicks a link on another website to reach yours, it is classified as referral traffic. This could come from a guest post, a partner’s website, or an online directory. High-quality referral traffic can be a significant asset.
- Social Traffic: This category encompasses all visitors from social media platforms like LinkedIn, X (formerly Twitter), or Facebook. It can be further segmented into Organic Social (from your regular posts) and Paid Social (from boosted posts or ads).

Putting Channel Data into Perspective
Analyzing these channels individually provides powerful clues about user behavior. Organic search is still the single dominant traffic source industry-wide: it generated more than 1 trillion visits across the sites Semrush tracks in 2025 alone. But the mix around it is shifting fast. Paid search grew 76% year over year, and AI-referred traffic (from tools like ChatGPT, Perplexity, and Copilot) grew 66%, even though it still accounts for under 0.15% of total visits industry-wide. You can explore the full breakdown in Semrush's 2026 traffic channel mix study.
By analyzing each channel's performance, you uncover hidden opportunities. If referral traffic from a single blog is converting exceptionally well, that’s a clear signal to pursue a deeper partnership.
This level of detail moves you far beyond simple traffic volume. For example, you might discover that while Paid Search generates a high number of sessions, visitors from Organic Search stay longer and have a much higher engagement rate. This is the kind of insight that allows you to fine-tune your marketing spend, directing resources toward channels that deliver real business value, not just clicks.
Focusing on Metrics That Truly Matter
It’s easy to get lost in the sea of data your analytics tool provides. Many teams chase metrics that look impressive on paper but fail to drive business growth. To extract real value from your traffic, you must filter out the noise and concentrate on the key performance indicators (KPIs) that signal success or failure.
Vanity metrics, like raw pageviews, may feel good to report, but they don't tell the whole story. The crucial question is whether those views are translating into sales, sign-ups, or other valuable actions. The goal is to focus on data that reflects how users actually behave on your site and how that behavior impacts your bottom line.
Moving Beyond Simple Counts
Modern analytics is not just about counting visitors; it’s about understanding their actions. While foundational metrics like total Users and Sessions remain important for gauging audience size, they are only the starting point.
These numbers answer "how many," but the real value lies in metrics that answer "so what?" and "was it worthwhile?" This is where engagement and conversion data become indispensable.
A high bounce rate on a product page isn't just a number; it’s a bright red flag telling you there's a disconnect between what a user expected and what you delivered. The real skill is connecting those data points to real-world business problems.
Core Metrics for a Healthy Dashboard
For a dashboard that provides a genuine pulse on your website's health, prioritize metrics that connect traffic directly to business outcomes. Here are the essential ones to start with:
- Engagement Rate: A key metric in Google Analytics 4, engagement rate is a significant improvement over the old Bounce Rate. It measures the percentage of sessions where a user was active for more than 10 seconds, triggered a key event, or viewed at least two pages. A healthy engagement rate strongly indicates that your content is resonating with your audience.
- Conversion Rate: This is a critical metric. Your conversion rate reveals the percentage of visitors who complete a desired action, whether it’s making a purchase, submitting a lead form, or subscribing to a newsletter. It is the metric that directly links traffic to business results.
- Average Engagement Time: This metric shows how long your site holds a user's attention while it is the active tab in their browser. Long engagement times on important pages, such as service descriptions or in-depth blog posts, are a fantastic indicator of high-quality, relevant content.
Mastering these digital marketing performance metrics is what separates data hoarders from data-driven strategists. By focusing on user interaction, you can make intelligent decisions that improve their experience and, consequently, drive more conversions.
The Power of Conversion Metrics
Ultimately, measuring website traffic is about understanding its business value. That’s why KPIs like conversion rate are so critical, they close the loop between website visitors and actual revenue or leads.
This isn't just an opinion. A 2024 HubSpot survey of 336 U.S. web professionals found that sales, leads, and conversion rates were the most important metrics for the second consecutive year. You can explore the full details in HubSpot’s comprehensive report on web traffic analytics. This confirms what experienced marketers already know: successful organizations prioritize metrics that reflect real-world impact, not just traffic volume.
Analysing Website Traffic on Mobile and Desktop
It’s a simple truth: the way your audience uses your website is completely different depending on whether they're on a phone or a laptop. Segmenting your traffic data by device type, desktop, mobile, and tablet, isn't just a best practice. It is an essential step if you want to truly learn how to measure website traffic and gain an accurate understanding of your user experience.
Mobile visitors operate by a distinct set of rules. With mobile now accounting for just over 52% of all web visits worldwide as of Q1 2026 (per StatCounter data via Statista), a mobile-first approach is no longer optional.
Mobile users are five times more likely to abandon a task if a site isn’t optimized for their device.
This divergence in user behavior means you must analyze your metrics through different lenses. A short session duration on mobile doesn't necessarily indicate a problem; it often means a user on the go found what they needed quickly. The real goal is to identify patterns within these differences and extract actionable insights.
Identifying Friction in the User Experience
This is where device segmentation proves its value, by highlighting discrepancies between traffic volume and performance.
Have you ever encountered a site with high mobile traffic but a flatlining conversion rate? This is a classic indicator that there's a significant point of friction in your mobile user journey.
This friction could stem from various issues, such as a clunky checkout process that is difficult to navigate on a small screen or large images that cause slow load times, testing your visitors' patience. By isolating your mobile data, you can move from speculation to a clear diagnosis of where users are abandoning the process.
High mobile traffic is a great start, but it's only half the story. If those visitors aren't converting, you're not just missing opportunities, you're likely frustrating potential customers with a subpar experience.
A Mobile-First Analytics Audit Checklist
To identify and resolve these costly issues, conduct a "mobile-first" analytics audit. This is not an exhaustive, week-long investigation but a focused review designed to systematically uncover the most common roadblocks in your mobile experience.
Here’s a practical checklist to get you started:
- Analyze Mobile-Specific Funnels: Begin by creating segments in your analytics tool to examine your conversion funnels exclusively for mobile users. Where are they dropping off? Pay close attention to the steps between adding an item to the cart and completing the purchase.
- Check Top Mobile Landing Pages: Identify the primary entry points for your mobile visitors. What are their Engagement Rate and Bounce Rate? A high bounce rate on a key landing page often signals a disconnect between user expectations and your content.
- Evaluate Page Load Speed: Speed is paramount on mobile. Use a tool like Google's PageSpeed Insights to test your most important mobile pages. Slow performance is one of the leading reasons for visitor abandonment.
- Review On-Site Search Behavior: Investigate what mobile users are searching for on your site. If they cannot find what they need quickly, it indicates that your site's navigation or information architecture may need refinement.
Following this checklist will help you transform raw data into a concrete action plan for elevating your mobile experience and, ultimately, boosting conversions across all devices.
Turning Your Traffic Data into Action
Collecting data is just the beginning; it's the easy part. The real value is realized when you apply your findings to make intelligent, strategic decisions. Too many businesses allow their analytics reports to go unused, creating a gap between analysis and action where valuable opportunities are lost.
First, establish business-relevant goals. A vague objective like "get more traffic" is ineffective. Be specific. A much better goal is, "increase qualified leads from organic search by 15% this quarter." This type of target provides a clear direction for your strategy and a measurable benchmark for progress.
Finding a Rhythm for Reporting and Testing
With clear goals established, it's time to create a consistent reporting rhythm. The aim is not to overwhelm your team with complex spreadsheets but to deliver concise, relevant insights to the right people, keeping everyone informed without causing data fatigue.
Next, you must validate your ideas with A/B testing. For instance, if your data suggests a new headline on a key landing page could increase engagement, don't just implement the change and hope for the best, test it. This methodical approach ensures your decisions are supported by real evidence, not just intuition. This is the essence of effective, data-driven marketing solutions.
Channel-specific conversion data often surfaces a clear disconnect. Paid social ads drive substantial traffic, but leads from organic search convert at a much higher rate.
When you reallocate ad spend from paid social toward content marketing and SEO, you improve lead quality without increasing your total marketing budget. The signal is in the conversion data, not the raw traffic counts.
This is a textbook example of putting traffic data to work. The win comes from using channel-level insights to make a strategic pivot that has a direct impact on the bottom line.
Your data holds the same potential. It is the roadmap for smarter, more sustainable growth. By connecting your analytics to concrete business goals, establishing a consistent reporting cadence, and testing your hypotheses, you can transform raw numbers into your most powerful asset.
Still Have Questions About Measuring Traffic?
Once you've set up your tools and identified your key metrics, you will inevitably encounter some perplexing questions. This is completely normal. Let's address some of the most common queries that arise when you start analyzing your website traffic data.
How Often Should I Be Checking My Website Traffic?
There is no single correct answer, it truly depends on the rhythm of your business. For most, a weekly check-in is the sweet spot. This frequency allows you to spot emerging trends, assess the performance of recent marketing efforts, and catch any significant issues before they escalate.
However, if you've just launched a major advertising campaign or a website redesign, daily monitoring is advisable. This enables you to react quickly if something isn't resonating with your audience. The key is to establish a consistent schedule that provides insight without leading to data overload.
What’s a Good Engagement Rate?
This is the classic "it depends" question. A "good" engagement rate can vary widely based on your industry, content type, and traffic sources.
As a general benchmark in Google Analytics 4 (GA4), an engagement rate above 55-60% is considered quite healthy. You might see rates exceeding 70% from highly targeted sources like an email newsletter, whereas broader campaigns may naturally have lower rates.
My advice is to stop chasing a universal number and start benchmarking against your own performance. Your primary goal should be steady, incremental improvement.
Don't get hung up on hitting an arbitrary industry benchmark. The real win is understanding what engagement looks like for your audience and pushing that number up, month after month. A rising trend is the best success signal you can have.
Why Did My Traffic Suddenly Drop?
A sudden drop in traffic can be alarming, but there is almost always a logical explanation. Before panicking, review this checklist of common causes:
- Technical Glitches: The simplest explanation is often the correct one. A broken tracking code or a server issue can make it appear as though your traffic has vanished. Always verify your site's technical health first.
- Algorithm Shake-ups: A major Google algorithm update can reshuffle search rankings overnight, affecting your organic traffic.
- Seasonal Dips: Is your business seasonal? A retailer selling ski equipment will naturally experience a traffic decline in July. This is a predictable part of the business cycle.
- A Campaign Ended: Did a large paid advertising campaign just conclude? This will result in a clear and expected drop in your paid traffic figures.
The first step is to segment the traffic drop by channel. If only your organic search traffic has decreased, it is likely an SEO-related issue. If all channels dropped simultaneously, you are almost certainly facing a technical problem.
How Can I Tell Which Traffic Source Drove a Sale?
This is an excellent question that moves you from simply measuring traffic to performing more advanced analysis. Pinpointing which channels are generating revenue is the core purpose of marketing attribution.
The first step is to set up conversion goals in your analytics platform. This will allow you to see which channels, such as organic search, paid social, or email, are driving the most sales.
To gain a complete understanding, however, you will want to explore different attribution models. It is worthwhile to understand what marketing attribution is and how it illuminates the entire customer journey, providing a clearer view of how to credit the various touchpoints that lead to a conversion.
Is There a Way to Check Any Website's Traffic, Even One I Don't Own?
Yes, though the number is always an estimate. To lookup website traffic for a domain you don't control, use a third-party website traffic checker such as Similarweb, Ahrefs, or Semrush's Traffic Analytics. Each one produces a website estimate traffic figure from clickstream panels, DNS-adjacent signals, and search-ranking data, not a copy of the site's real analytics account, so treat the number as directional. If you just want to check any websites traffic quickly for a competitive gut-check, cross-reference at least two of these estimators before you act on the number: a single tool's estimate can be off by a wide margin, especially on smaller or heavily-segmented sites.
At Twelverays, we turn complex data into clear, actionable growth strategies. If you're ready to go beyond just counting visitors and start driving real, measurable results, let's talk. Our data-driven demand generation services turn traffic into pipeline, not just impressions.