Business intelligence, or BI, is the combination of tools, technologies, and processes that let you collect, analyze, and present data to understand your business. In practice that covers customer-behavior analysis, predictive analytics, performance metrics, and the actionable insights that come out of them. Companies use BI to spot new opportunities, pressure-test existing models to find where they can improve, monitor the performance of individual departments, and track the metrics that show whether the business is on pace to hit its targets. BI is not just for big companies. Small businesses run on it too. Cloud and mobile tools put real-time metrics and analysis within reach of a team of any size.
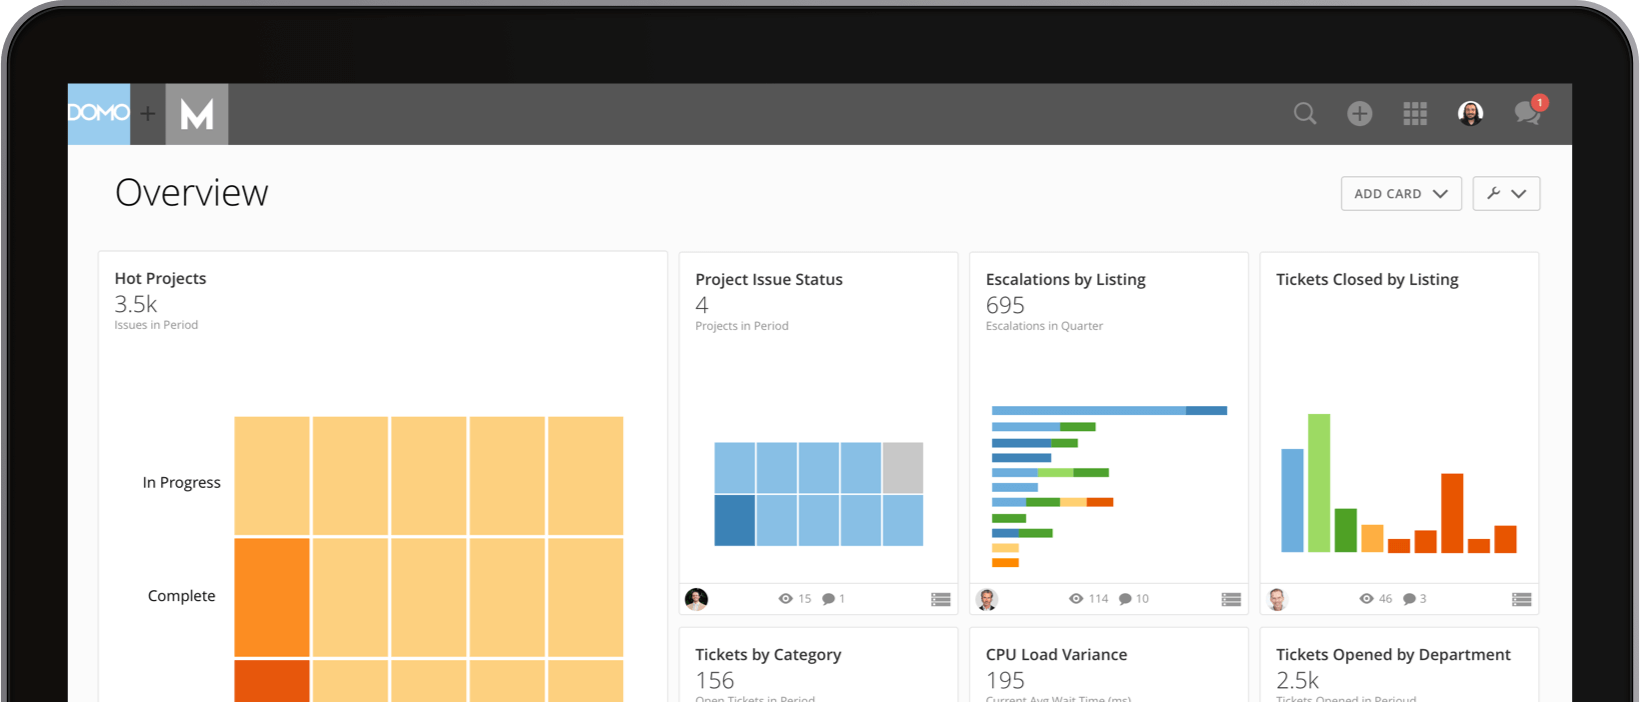
Business intelligence software gives decision-makers the detail they need to make informed choices. It replaces guesswork and gut feel with evidence. BI pulls from the systems where your data already lives: CRM systems like Salesforce, supply-chain data, sales dashboards, marketing analytics, contact-center records, and the metadata that describes all of it. A BI platform brings these scattered sources into one unified view and delivers real-time reporting, dashboards, and analysis on top of them. The result is a single place to ask questions of your data and get answers fast, instead of stitching numbers together across a dozen spreadsheets.
Benefits of BI
Data-Driven Business Decisions: Accurate data and faster reporting produce better decisions. Leaders can pull real-time figures and sales forecasts before a meeting and speak to a prospect's needs with confidence, knowing the numbers are current. No one waits days or weeks for a report or acts on stale data.
Enhanced business performance: When teams spend fewer hours compiling reports, they spend more time acting on what the data tells them. BI gives leaders a holistic view of operations and a way to benchmark results across the business, which makes areas of opportunity easy to spot.
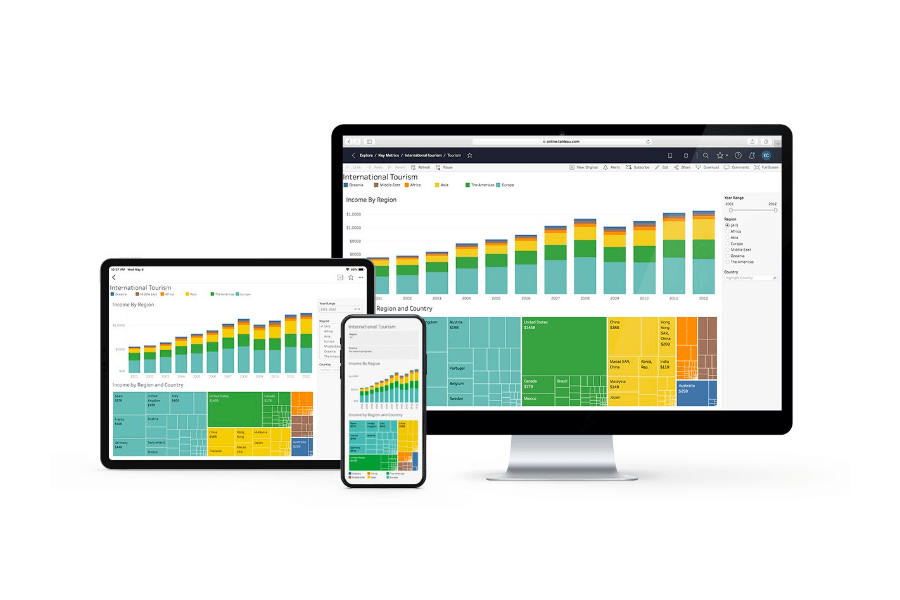
Faster Analysis: BI systems do heavy processing in the cloud or on your own servers, pulling data from many sources into a warehouse and analyzing it against user queries, drag-and-drop reports, and dashboards. The speed is real: Tableau reports that Lenovo increased reporting efficiency by 95% across its enterprise, with its HR team consolidating more than 100 static reports into a set of strategic dashboards, and that PepsiCo cut report production time by as much as 90% using Tableau with Trifacta. BI makes analysis intuitive enough that non-technical people can explore data without writing code.
Identifying Market Trends: Combining external market data with your internal data surfaces new sales trends and emerging problems early. That head start lets analysts build a strategy on solid evidence and gives the whole organization a competitive edge.
Establish Benchmarking: Fast, reliable decisions depend on knowing where you stand. BI runs the equivalent of a continuous research project, assembling timely information so you can measure performance, revenue, and overall success against competitors and against your own history. Benchmarking reports give organizations an accurate read on the company's current state against specific KPIs and trends over time. With predictive analytics layered on top, teams can act on those benchmarks proactively instead of reacting after the fact.
Each takes a different approach to modeling, visualization, and pricing, so the right choice depends on your data sources, your team's technical depth, and how you plan to share insights across the business.
Stop guessing. Start growing. In a world of noise, our direction helps you stay ahead.

.avif)