Key Takeaways
- What is Microsoft Power BI? Microsoft's business intelligence platform, turning data from Excel, SQL Server, and hundreds of other sources into interactive dashboards.
- What is Power BI used for? Tracking live KPIs and replacing static monthly exports with dashboards that update automatically.
- Is Power BI the same as Excel? No. Excel calculates one file at a time; Power BI connects live sources and shares one version of the truth.
- What does BI stand for in Power BI? Business Intelligence: analyzing historical and real-time data to surface decisions, not just record history.
- Power BI Report Server is the on-premises option for teams that need Power BI reporting without the cloud service.
- Power BI Pro costs $14 per user, per month, and Power BI Premium Per User costs $24 per user, per month, billed yearly.
What Is Microsoft Power BI?
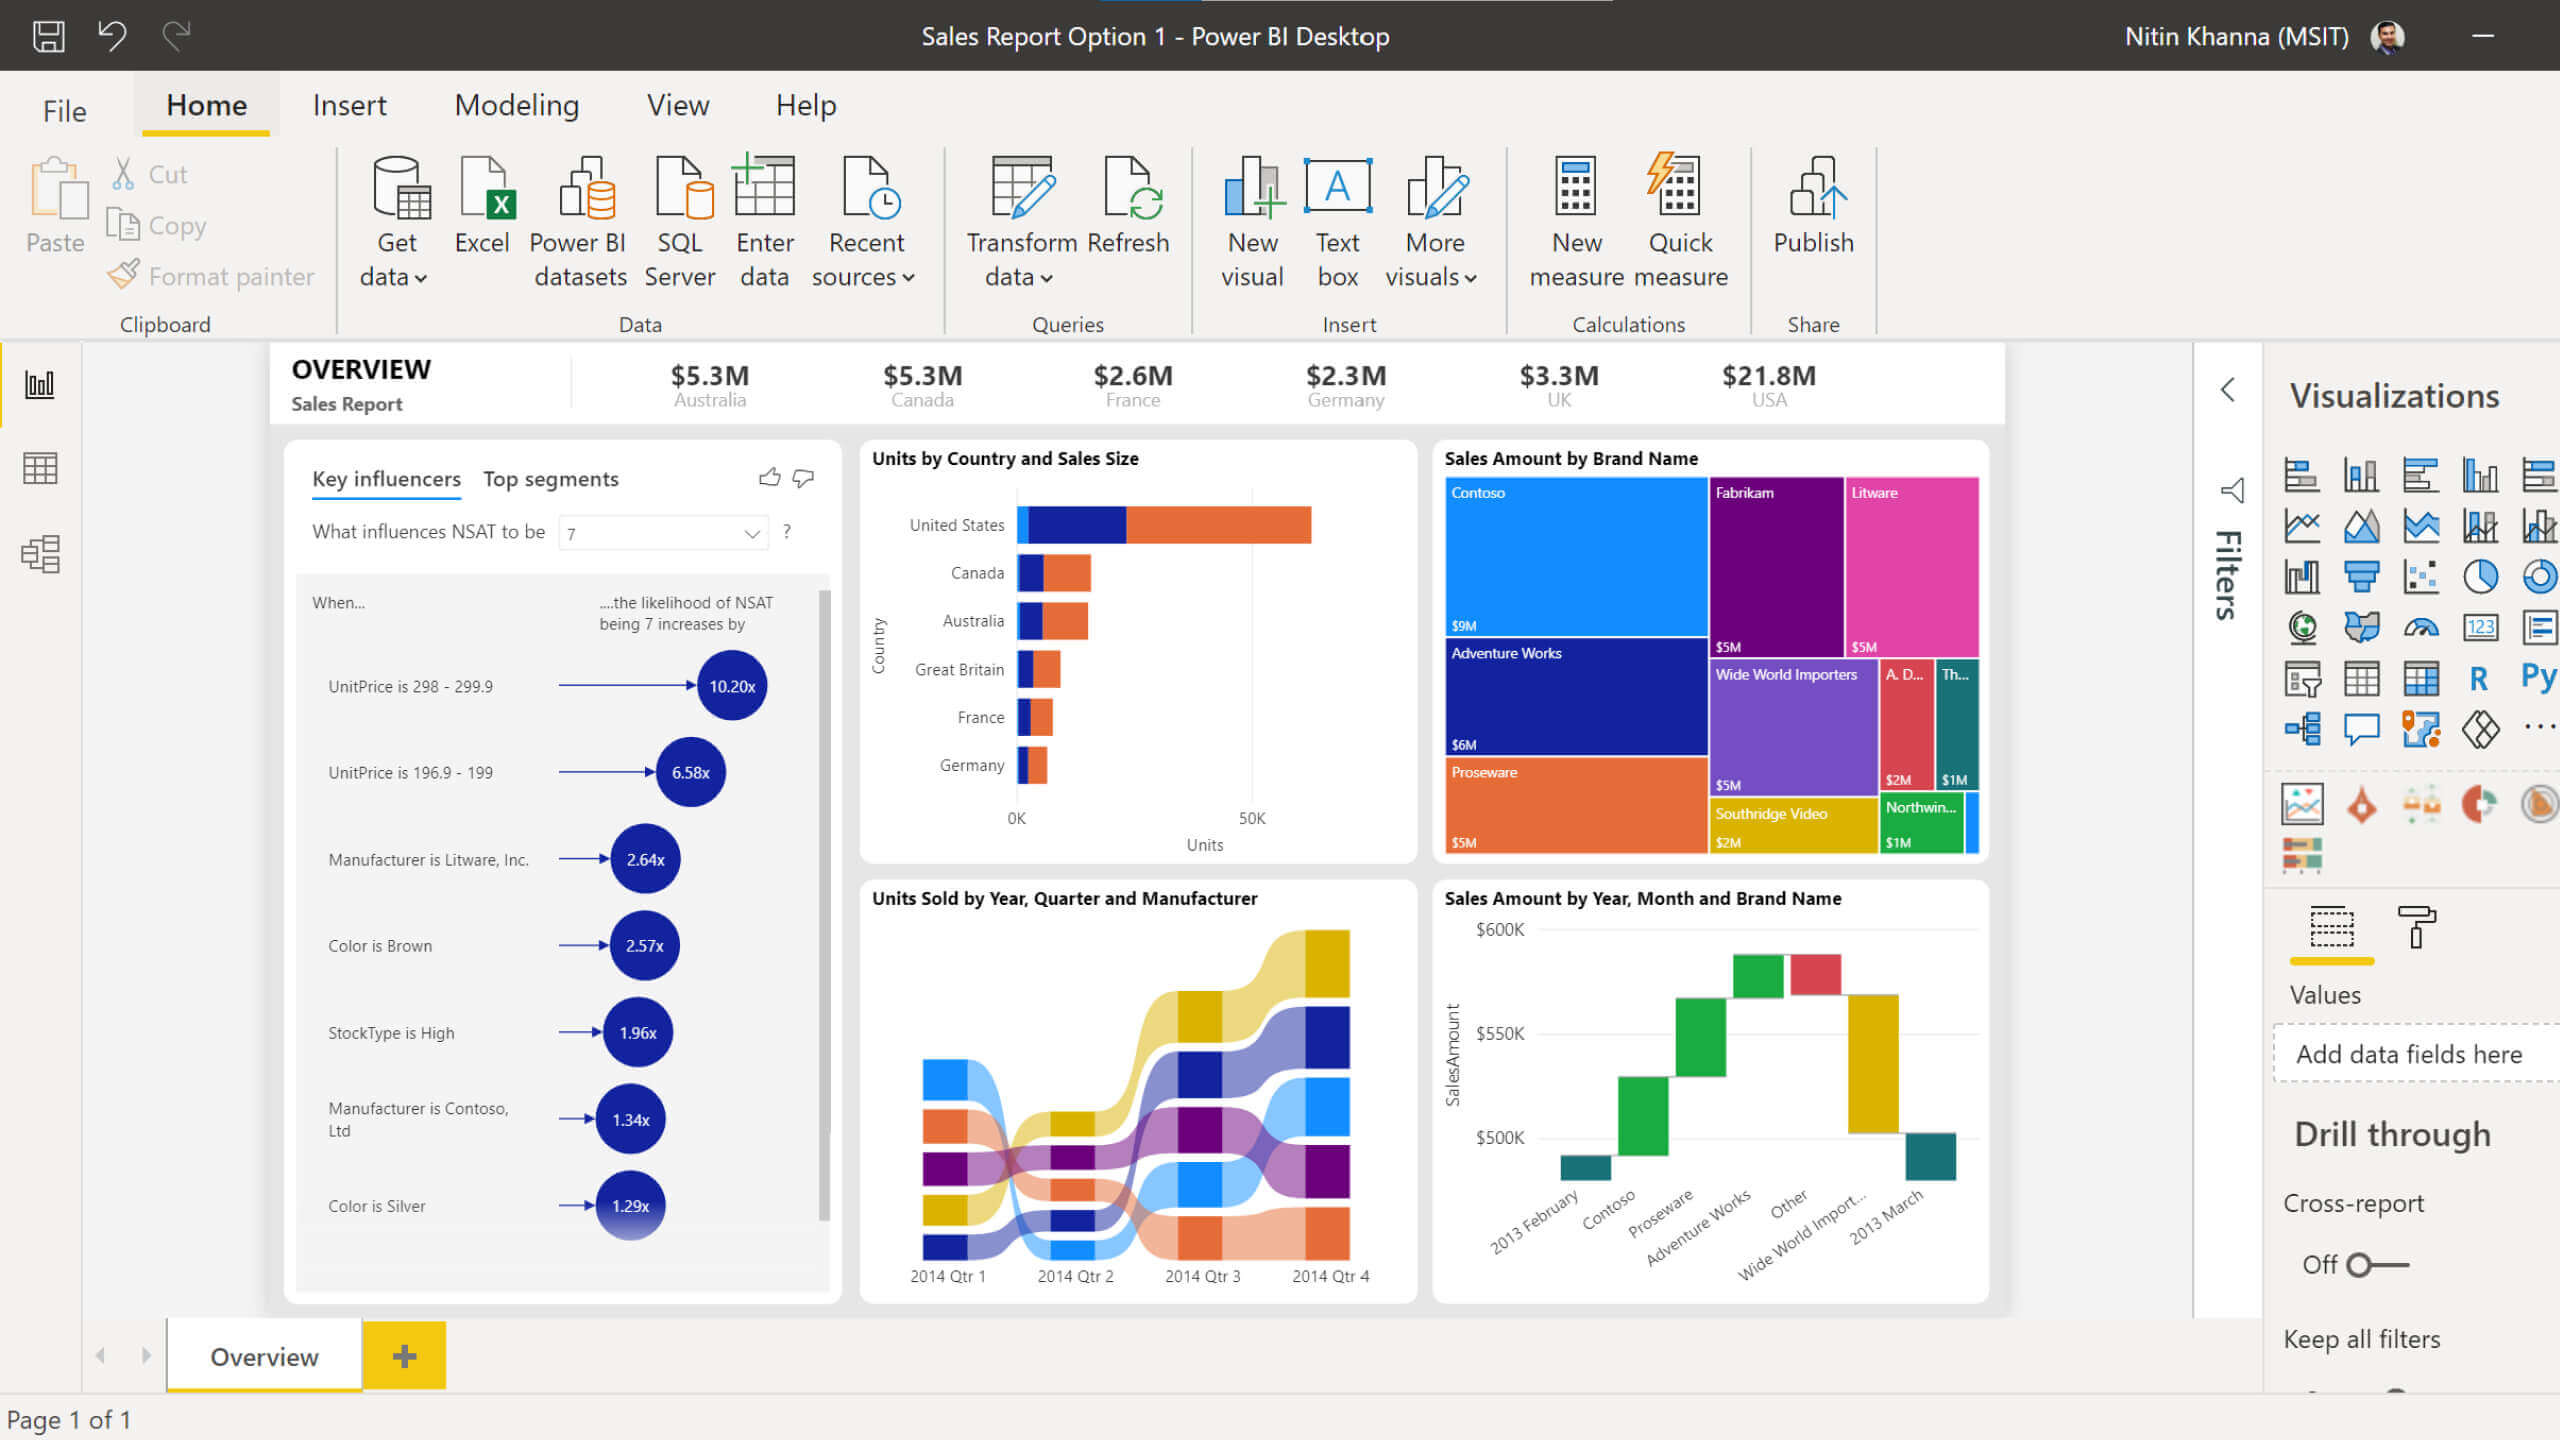
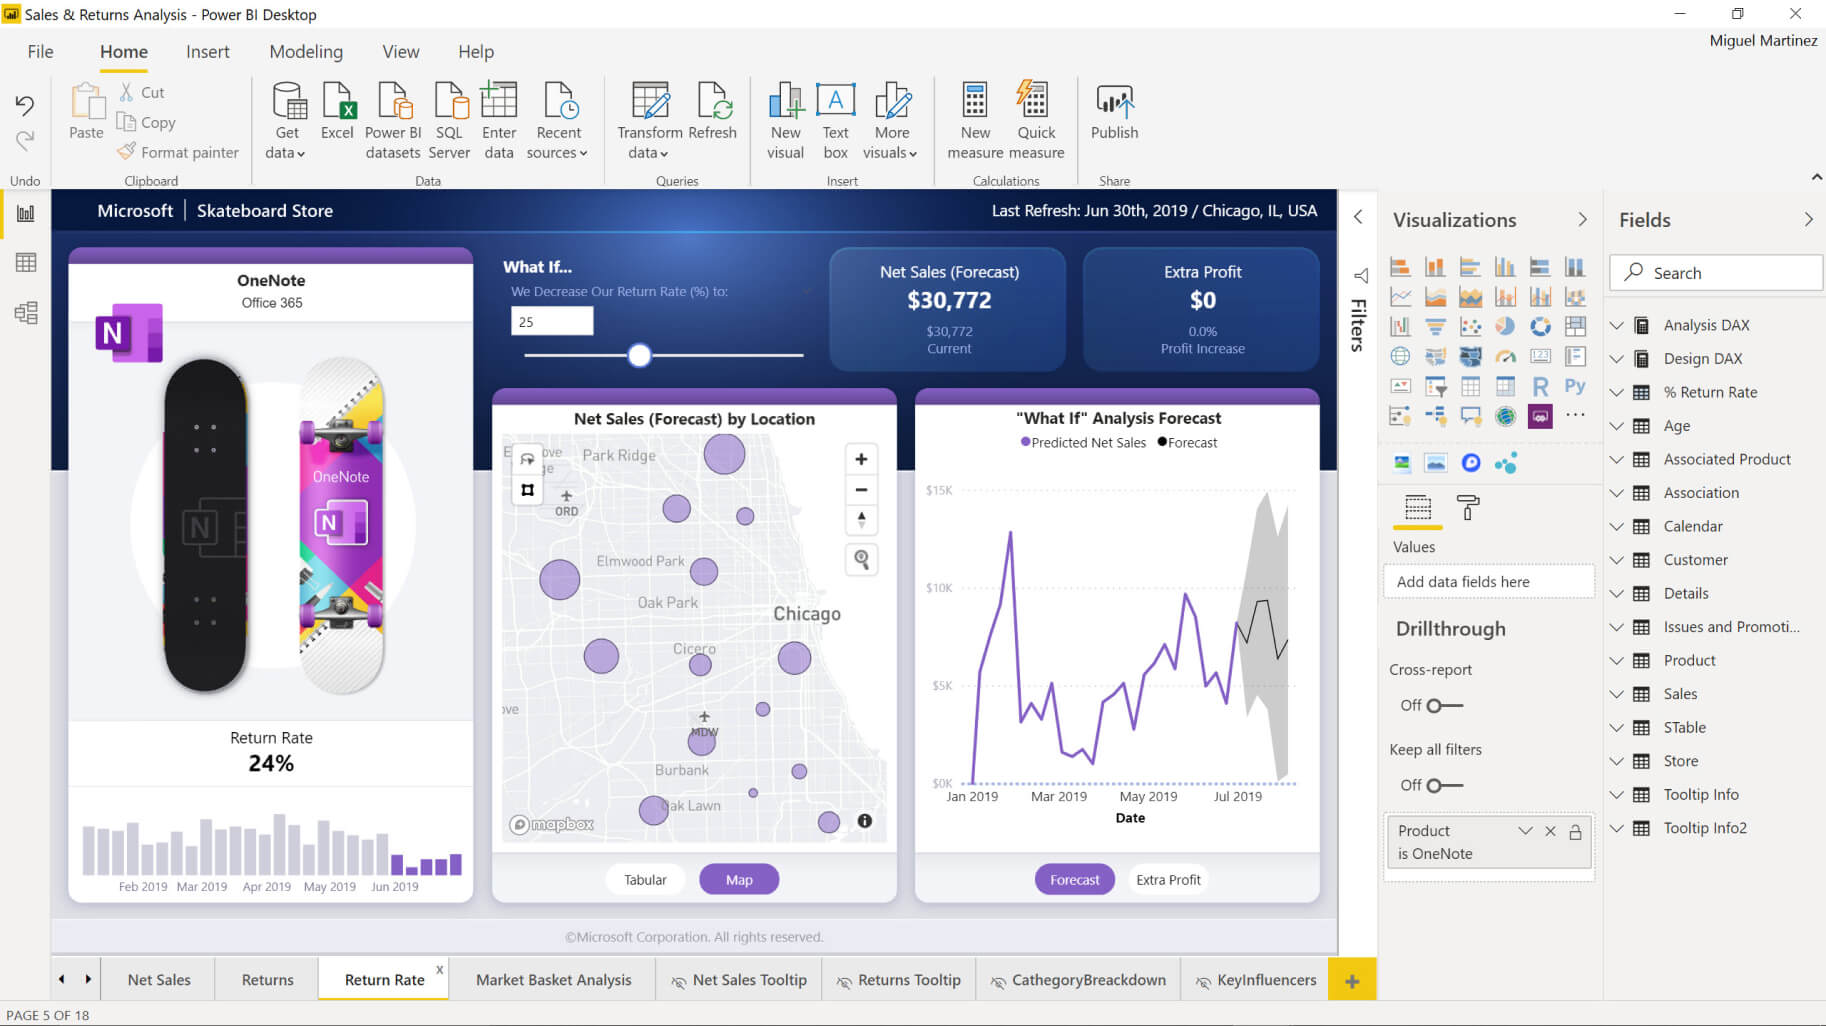
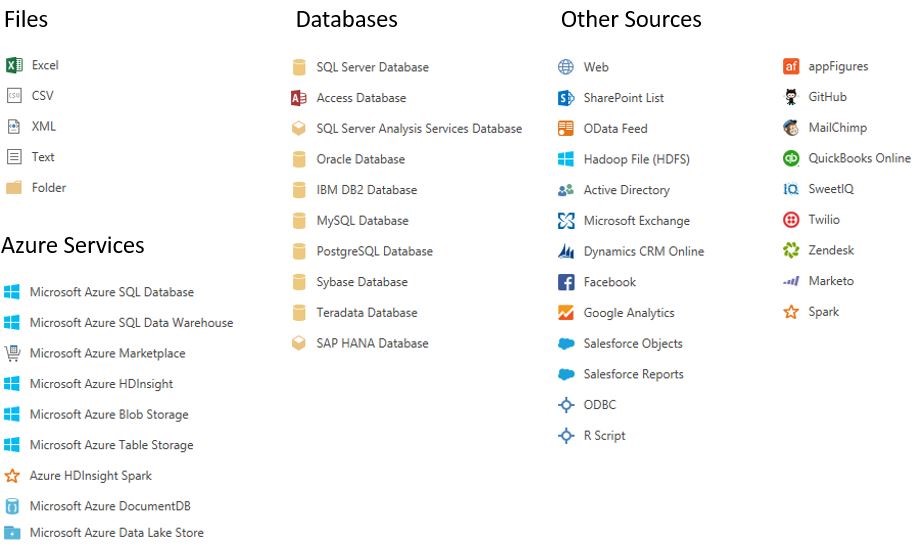
What is Microsoft Power BI? Microsoft Power BI is Microsoft's business intelligence service: a collection of apps, connectors, and cloud services that turns data from Microsoft Excel, SQL Server, Analysis Services, and hundreds of other sources into visualizations, dashboards, and reports.
Power BI has three main parts that work together. You author reports in Power BI Desktop, publish and share them through the Power BI service, and consume them as a Power BI user in a browser or the mobile app.
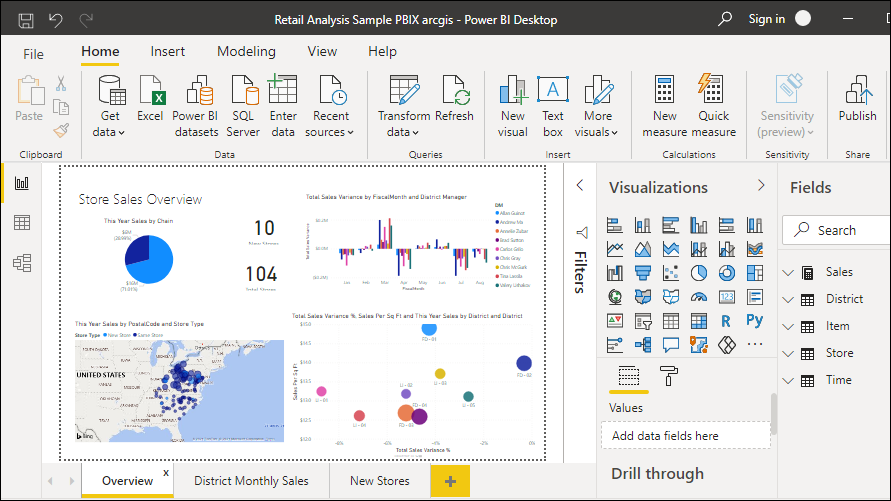
- Power BI Desktop is the free Windows application for connecting to data, modeling it, and building reports.
- Power BI service is the cloud platform where you publish, share, and collaborate.
- Power BI user is anyone who views or interacts with a published report, in a browser or on mobile.
Sharing and collaboration run on per-user licenses: Fabric (Free), Power BI Pro, and Premium Per User.
RELATED: 10 Ways Dynamics 365 Can Streamline Your Business
What Does BI Stand for in Power BI?
What does BI stand for in Power BI? BI is short for Business Intelligence: analyzing historical and real-time data to surface decisions instead of just recording what already happened. A static report tells you last quarter's revenue; business intelligence tells you why it dropped.
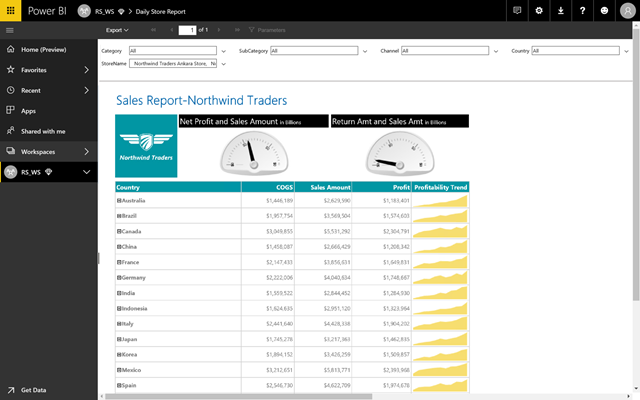
That distinction is what separates a spreadsheet export from Power BI data visualization: hundreds of chart types and live refresh that updates the moment the underlying source changes.
Is Power BI the Same as Excel?
Is Power BI the same as Excel? No. Excel is a single-workbook calculation tool. Power BI is a connected reporting platform that models the relationships between live sources and shares one version of the truth across an organization.
Excel breaks down the moment a dataset grows past what one spreadsheet can hold. Microsoft caps a single worksheet at 1,048,576 rows by 16,384 columns. Power BI has no such ceiling: it queries the source directly and can model millions of rows without loading them into a grid.
| Excel | Power BI | |
|---|---|---|
| Data volume | Capped at 1,048,576 rows per sheet | Models millions of rows from the source |
| Refresh | Manual re-export | Scheduled or real-time |
| Collaboration | Version conflicts across shared files | One published report, one source of truth |
| Visualization | Charts and pivot tables | Interactive dashboards, drill-through |
Excel still wins for quick, one-off analysis. Power BI takes over once that analysis needs sharing, automated refresh, or more than one data source.
What Is Power BI Report Server?
Power BI Report Server is an on-premises reporting server. It lets you create reports and datasets and share them with people across your organization, including those who do not have access to the Power BI service.
You can connect Power BI Report Server to a wide range of data sources, including on-premises data lakes and third-party data through a REST API. It runs entirely on-premises, so you can use it without the cloud Power BI service.
Power BI Report Server is comparable to both SQL Server Reporting Services and the Power BI online service, in different ways. Like the cloud service, Power BI Report Server hosts Power BI reports.
Power BI Report Server's features are a superset of Reporting Services. Everything you can do in Reporting Services you can also do in Power BI Report Server, and it adds support for Power BI reports.
RELATED: Various Reasons Why You Should Use Dynamics 365
Licensing Power BI Report Server
According to Microsoft, you get the right to run Power BI Report Server through one of three licenses: Power BI Premium, SQL Server Enterprise Edition with Software Assurance, or a Microsoft Fabric capacity at F64 and above. To publish Power BI reports to the server, report authors also need a Power BI Pro license. Viewers do not need Power BI Pro to open and interact with reports on Power BI Report Server. A Power BI Premium or Fabric license lets you run a hybrid deployment that blends cloud and on-premises.
Per-user licensing outside the Report Server follows the same tiers. Power BI Pro costs $14 per user, per month, and Power BI Premium Per User costs $24 per user, per month, both billed yearly.
RELATED: Microsoft Advertising & Dynamics 365 Integration
What Is Power BI Used For?
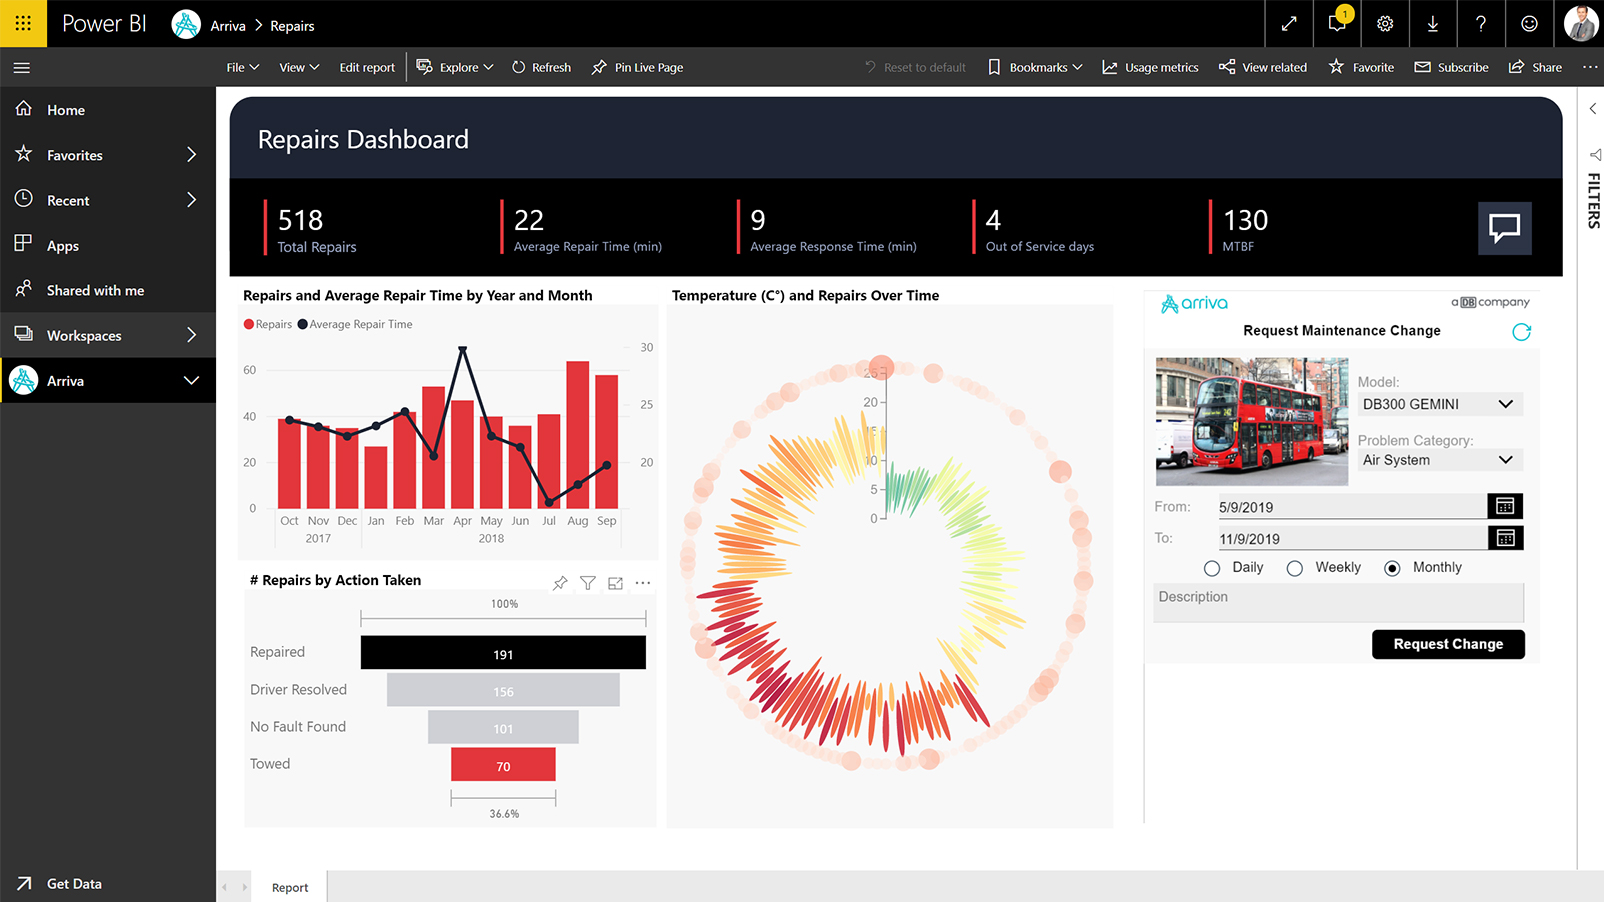
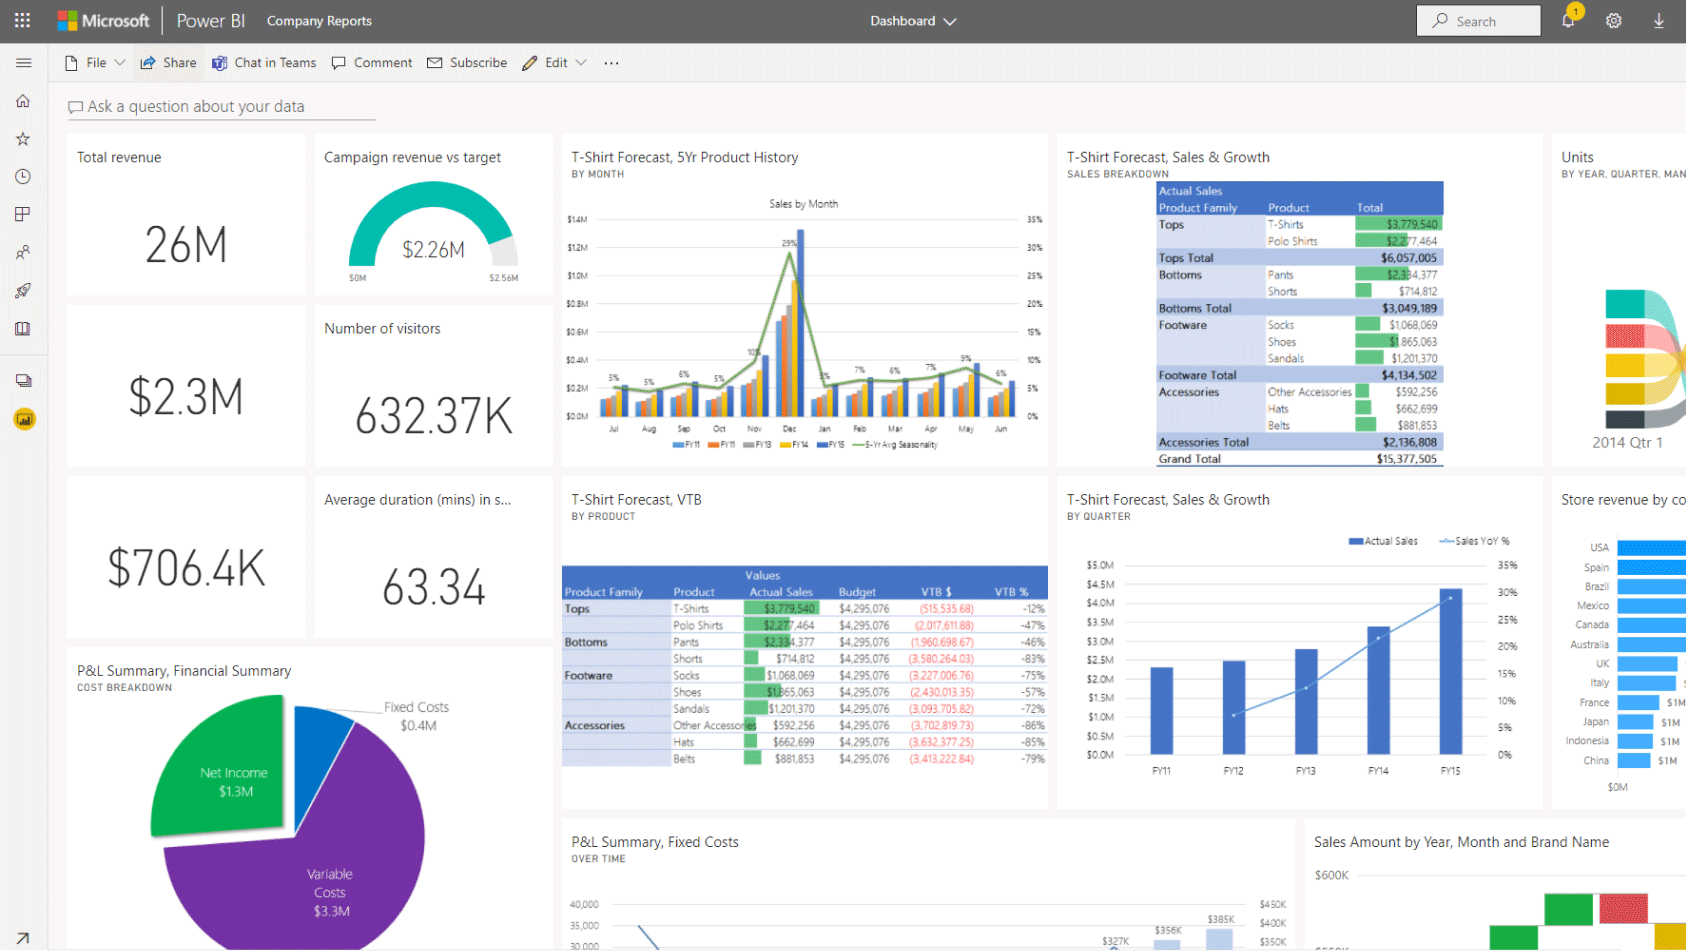
What is Power BI used for? Power BI is the reporting layer teams use for personalized dashboards, real-time analytics, and shared, governed reporting the whole company trusts.
Flexible
Business users build personalized dashboards with drag-and-drop tools. Interactive, rich visuals let them examine key data points fast and make informed decisions.
RELATED: 5 Best CRM Tools for Business Development
Stream Analytics in Real Time
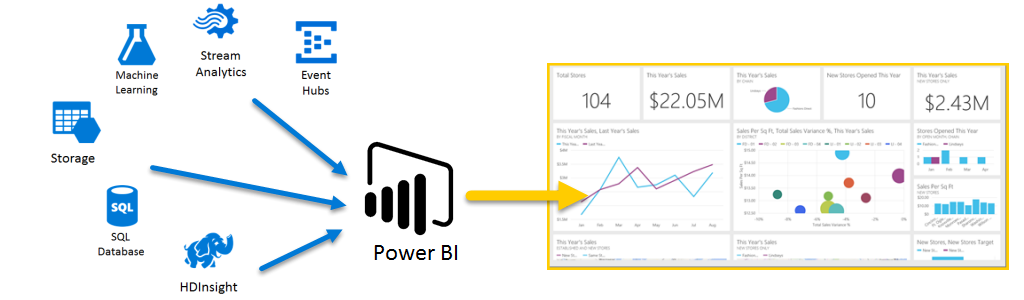
Know what is happening now, not just in the past. From factory sensors to social network feeds, Power BI gives you access to real-time analytics, so you are always ready to make timely decisions.
Get Excellent Excel Integration
Anyone who knows Microsoft 365 can connect Excel queries, data models, and reports to Power BI dashboards. That makes it easy to gather, analyze, publish, and share Excel data in new ways.
Turn Actionable Insights Into Action
Go from data to insights and insights to action with the Microsoft Power Platform. Combine Power BI with Power Apps and Power Automate to build business applications and automate workflows. Real-time data lets you make informed decisions for your business.
RELATED: 5 Best CRM for Startups
Improve Publishing Efficiency and the Accuracy of BI Content
Move and compare content from development and testing to production with confidence. Deployment pipelines use simple visual cues to show what changed.
Link Self-Service and Enterprise Analytics
Meet your self-service and enterprise analytics needs on one platform. Access powerful semantic models, an application lifecycle management (ALM) toolkit, an open connectivity framework, and fixed-layout, pixel-perfect paginated reports.
RELATED: 5 Best CRM for Real Estate
Accelerate Big Data Prep with Azure
Simplify how you analyze and share large volumes of data. An Azure data lake is the no-limits layer that cuts the time to insight and improves collaboration between business analysts, data engineers, and data scientists.
Find Answers Fast with Industry-Leading AI
Use the latest advances in Microsoft AI to help non-data scientists prepare data, build machine learning models, and find insights fast from both structured and unstructured data, including text and images.
RELATED: Failures of CRM Implementation: 5 Common Challenges
Microsoft Power BI and Power Automate
Power BI highlights the problem. Microsoft Power Automate triggers the fix. A dashboard alone delivers insight; insight without action is just a well-designed warning sign. When Power BI flags an anomaly, a dip in pipeline value, a spike in support tickets, Power Automate can push an alert or log a task without anyone watching the dashboard.
Twelverays treats Power BI and Power Automate as one connected stack. Power Automate connects apps and runs repetitive work behind the scenes; Microsoft Power Automate extends that automation to the same sources Power BI already models. Teams building both sides of that stack alongside Microsoft Dynamics 365 get one data model that feeds reporting and automation together. For concrete starting points, these Power Automate examples show the pattern in practice.
Power BI FAQ
What Is a Deployment Pipeline Tool?
A deployment pipeline tool is the mechanism Power BI uses to deploy reports, dashboards, datasets, and paginated reports across development, test, and production stages.
What Are the Benefits of Using Power BI?
You find and share meaningful insights with hundreds of data visualizations, built-in AI capabilities, tight Excel integration, and prebuilt and custom data connectors.
What Are the Benefits of Using Analytics?
Analytics is the layer that lets everyone at every level of your organization make confident decisions using up-to-the-minute data.
What Is Power BI Desktop?
Power BI Desktop is a free, self-service data analysis and report authoring tool that you install on a Windows computer.
What Is Microsoft Power BI App?
The Microsoft Power BI mobile app is the consumption layer: it renders live dashboards on iOS and Android so you can check pipeline figures without opening a laptop.
What Are the Benefits of Power BI Premium?
Power BI Premium is a capacity-based licensing tier that lets you publish reports across an enterprise without licensing every recipient individually. It delivers greater scale and performance than shared capacity in the Power BI service. It lets you keep BI assets on-premises with Power BI Report Server. It gives you one API surface, a consistent set of capabilities, and access to the latest features for embedded analytics.
What Is Power Query?
Power Query is the easiest way to connect, extract, transform, and load data from a wide range of sources.
What Is Data Connectivity and Data Preparation?
Microsoft's data connectivity and data preparation technology is the layer that lets you access data stored in hundreds of sources and reshape it to fit your needs, all through an easy-to-use, no-code experience.
What Are the Benefits of Power Query?
Power Query gives you hundreds of transformations in the Power Query Editor. You transform data with more flexibility than any other tool, including smart AI-based transformations.
What Are the Benefits of Visual Analytics?
Visual analytics is the layer that ranges from basic reporting to advanced analytics, with hundreds of visuals and features so you decide how to deliver insights to your users.
What Is Power Pivot?
Power Pivot is an Excel add-in for powerful data analysis and sophisticated data models.
What Are the Features of Power Pivot for Excel?
Power Pivot for Excel is the import engine for millions of rows of data from multiple sources into a single workbook. You create relationships between heterogeneous data, build calculated columns and measures with formulas, and create PivotTables and PivotCharts to analyze the data and make timely business decisions, all without IT assistance.
What Is the Difference Between Power Pivot and Excel?
The difference between Power Pivot and Excel is scale: Power Pivot builds a more sophisticated data model than standard Excel supports, working in the dedicated Power Pivot window.